Basic HTML Version


International Journal of Marine Science 2015, Vol.5, No.5: 1-8
http://ijms.biopublisher.ca
4
Table 2 Information for the PCR reactions conducted for six gene regions
3 Results
Derived discriminant function received by analyses of
size-corrected data identified four morphometric
parameters as significant contributors (Wilk′s Lamda:
P<0.05), (Table 3). The landmarks of four morphometric
parameters are 3~17, 4~15, 5~14 and 9~12. The cross
validated classification showed that overall 87% were
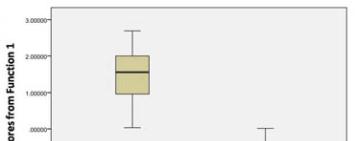
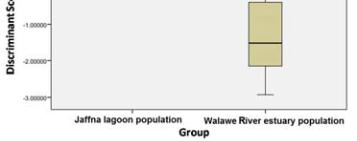
correctly classified. The box-plot graphs plotted using
canonical scores derived from DFA analysis is given
in the Figure 3.
The information of the sequences recovered for six
gene regions are given in the Table 1. Mitochondrial
control gene region showed high diversity level
producing seven haplotypes which are common for
both populations. Among three haplotypes resulted for
COI gene region only one haplotype shared between
two populations. Other gene regions produced single
haplotype each which was common for both populations.
Percentage of mean nucleotide divergence levels
varied from 0.8% to 5.2% for control gene region and
for COI gene region it was ranged from 0.1% to 0.3%.
Neighbor Joining (NJ) trees constructed using derived
sequences of mitochondrial control gene region and
COI gene region are given in the Figure 4 and 5
respectively.
4 Discussion
Out of twenty one morphometric parameters only four
parameters strongly contributed in separation of two
populations. Among them diagonal length of the 3
rd
abdominal segment (5~14) act as the strongest
predictor. Derived graph indicated the separation of
two populations with slight overlapping but centroids
for two populations were clearly separated (Figure 3).
Figure 3 Graph illustrates distribution of the discriminant
function scores for two populations and their separation
Gene region
Primer details
Reference
PCR conditions (30 cycles)
Denaturing Annealing Elongation
Mitochondrial
16S rRNA
1471 5'-CGCCTGTTTAACAAAAACAT-3'
1472 5'-AGATAGAAACCAACCTGG-3'
Crandall and
Fitzpatrick, 1995
92
℃
-30s
50
℃
-30s 72
℃
-1min
Mitochondrial
12S rRNA
12SF 5'-GAAACCAGGATTAGATACCC-3'
12SR 5'-TTTCCCGCGAGCGACGGGCG-3'
Mokady et al., 1994
92
℃
-30s
48
℃
-30s
72
℃
-30s
Mitochondrial
COI subunit
LCO1490 5'-GGGGTCAACAAATCATAAA
GATATTGGGG-3'
HCO2198 5'-TAAACTTCAGGGGGGGGGT
GACCAAAAAATC-3'
Folmer et al., 1994
92
℃
-30s
50
℃
-45s
72
℃
-45s
Mitochondrial
Control
12S 5'-AAGAACCAGCTAGGATAAAACTTT-3'
1R 5'-GATCAAAGAACATTCTTTAACTAC-3'
Chu et al., 2003
92
℃
-30s
48
℃
-1min 72
℃
-40s
Nuclear 18S
RNA
18SC 5'-CGG TAA TTC CAG CTC CAATAG-3'
18SY 5'-GTT GGT GGA GCG ATT TGTCTG-3'
Medlin et al., 1988
92
℃
-30s
50
℃
-45s
72
℃
-1min
Nuclear H3
H3AF 5'-ATGGCTCGTACCAAGCAGACVGC-3'
H3AR 5'-ATATCCTTRGGCATRATRGTGAC-3'
Colgan et al., 1998
92
℃
-30s
50
℃
-30s
72
℃
-30S