Molecular Plant Breeding 2015, Vol.6, No.18, 1
-
8
5
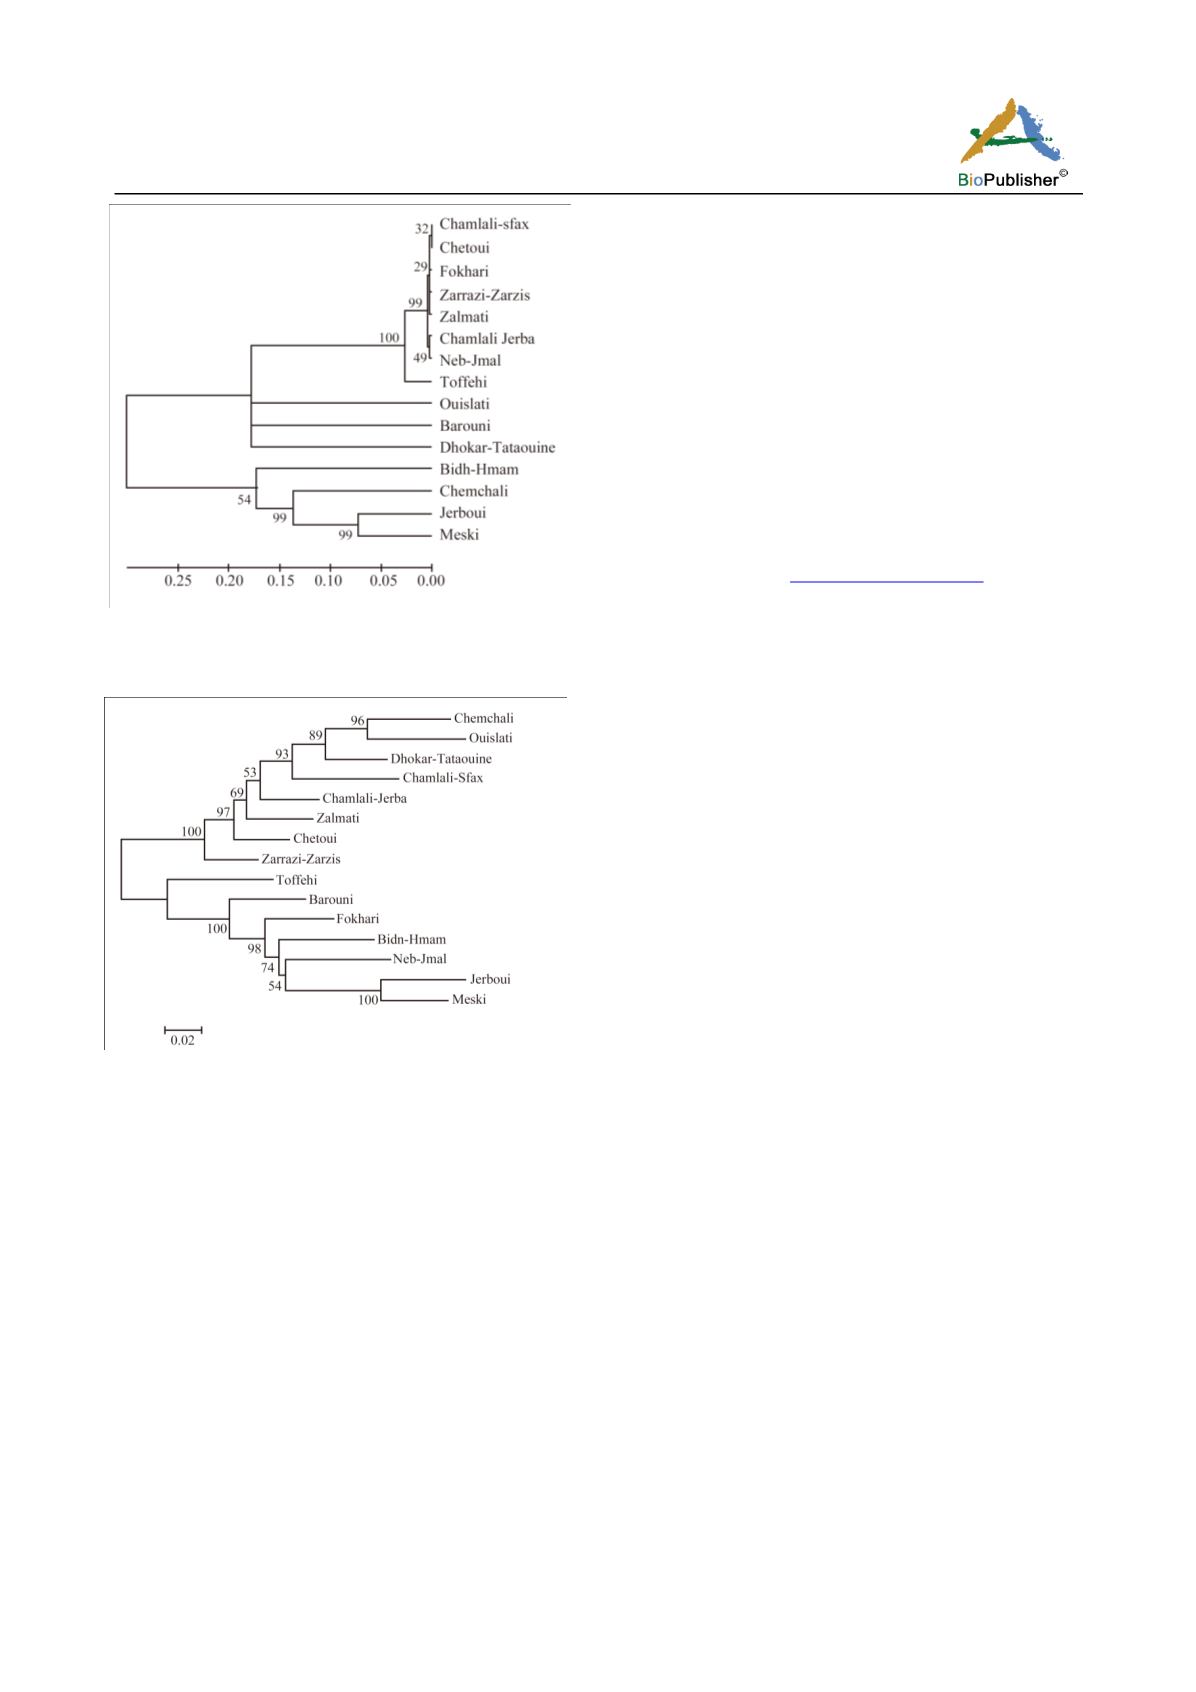
Figure 1 UPGMA dendrogram showing the discrimination of
the studied cultivars based on
TIP
DNA sequence
Figure 2 UPGMA dendrogram showing the discrimination of
the studied cultivars based on
PIP2
DNA sequence.
3 Material and methods
3.1 Plant material and DNA extraction
The study was conducted on 15 main commercial
Tunisian olive cultivars which are listed in Table 1.
Most of the plant materials were obtained from the
National Olive Genetic Resources Conservation
located in Boughrara-Sfax. Cultivars were selected for
covering varying geographic and environmental
ranges with different amount of precipitation in
Tunisia (Table 1).
Total genomic DNA was extracted from small leaves
using hexadecyl trimethyl ammonium bromide
(CTAB) according to the method described by Doyle
and Doyle (1990).
DNA was purified, quantified, suspended in a TE
solution (pH 8) and stored at –20
℃
.
3.2 Molecular analysis
Two genes
namely
tonoplast intrinsic protein (
TIP
,
accession N°:
DQ202710.1) and
plasma membrane
intrinsic protein (
PIP2
, accession N°:
DQ202708.1)
from aquaporin gene family (AQPs)
which are
involved in olive drought response (Secchi et al.
2007b)
were selected for SNPs characterization on 15
Tunisian olive varieties
(Table 2
)
.
Reference DNA
sequences of these genes were obtained from the
National Centre for Biotechnology Information (NCBI)
GenBank database
.
5 primers for
TIP
and 6 primers for
PIP2
genes were
designed using the program Primer3 (v.0.4.0; Rozen
and Skaletsky 2000) in conserved regions. Only one
primer for each gene was selected for his usefulness in
genotyping olive cultivars. The forward and reverse
primer for each gene was indicated in Table 2.
PCR amplification was done in total volume of 25 μL
containing 1x PCR reaction buffer, 10 μM of each
primer, 0.20 mM dNTPs, and 3U of DNA Taq
polymerase. The PCR was carried out on a BIORAD
programmable thermal controller as follows: initial
denaturation at 95 °C for 2 min; 35 cycles of 94 C°for
30 sec, an annealing step at 56-61C°for 30 sec (For
each candidate gene, a primer optimization step was
done on three genotypes) and 72 C°for 1.30 min, and
final extension at 72 C°for 5 min.
The expected size of each PCR product was
confirmed by separation on 1.5% agarose gel, stained
with ethidium bromide, and visualized under UV light.
The amplified PCR products were purified and
sequenced on an ABI sequencing instrument.
3.3 Data analysis
DNA sequences were examined visually as well as for
the analysis of SNPs within the genes, the sequences were
aligned using BioEdit version 7.0.9.0 (Hall 1999)
using ClustalW mul
TIP
le alignment (Thompson et al.
1994).
Analyses of sequence data were performed using
DnaSP v. 4.0 (Rozas et al. 2003). The nucleotide
diversity (π) is based on the average number of
nucleotide differences per site between sequences (Nei
and Li 1979), whereas (θw) is based on the number of


