International Journal of Marine Science 2015, Vol.5, No.56: 1-5
3
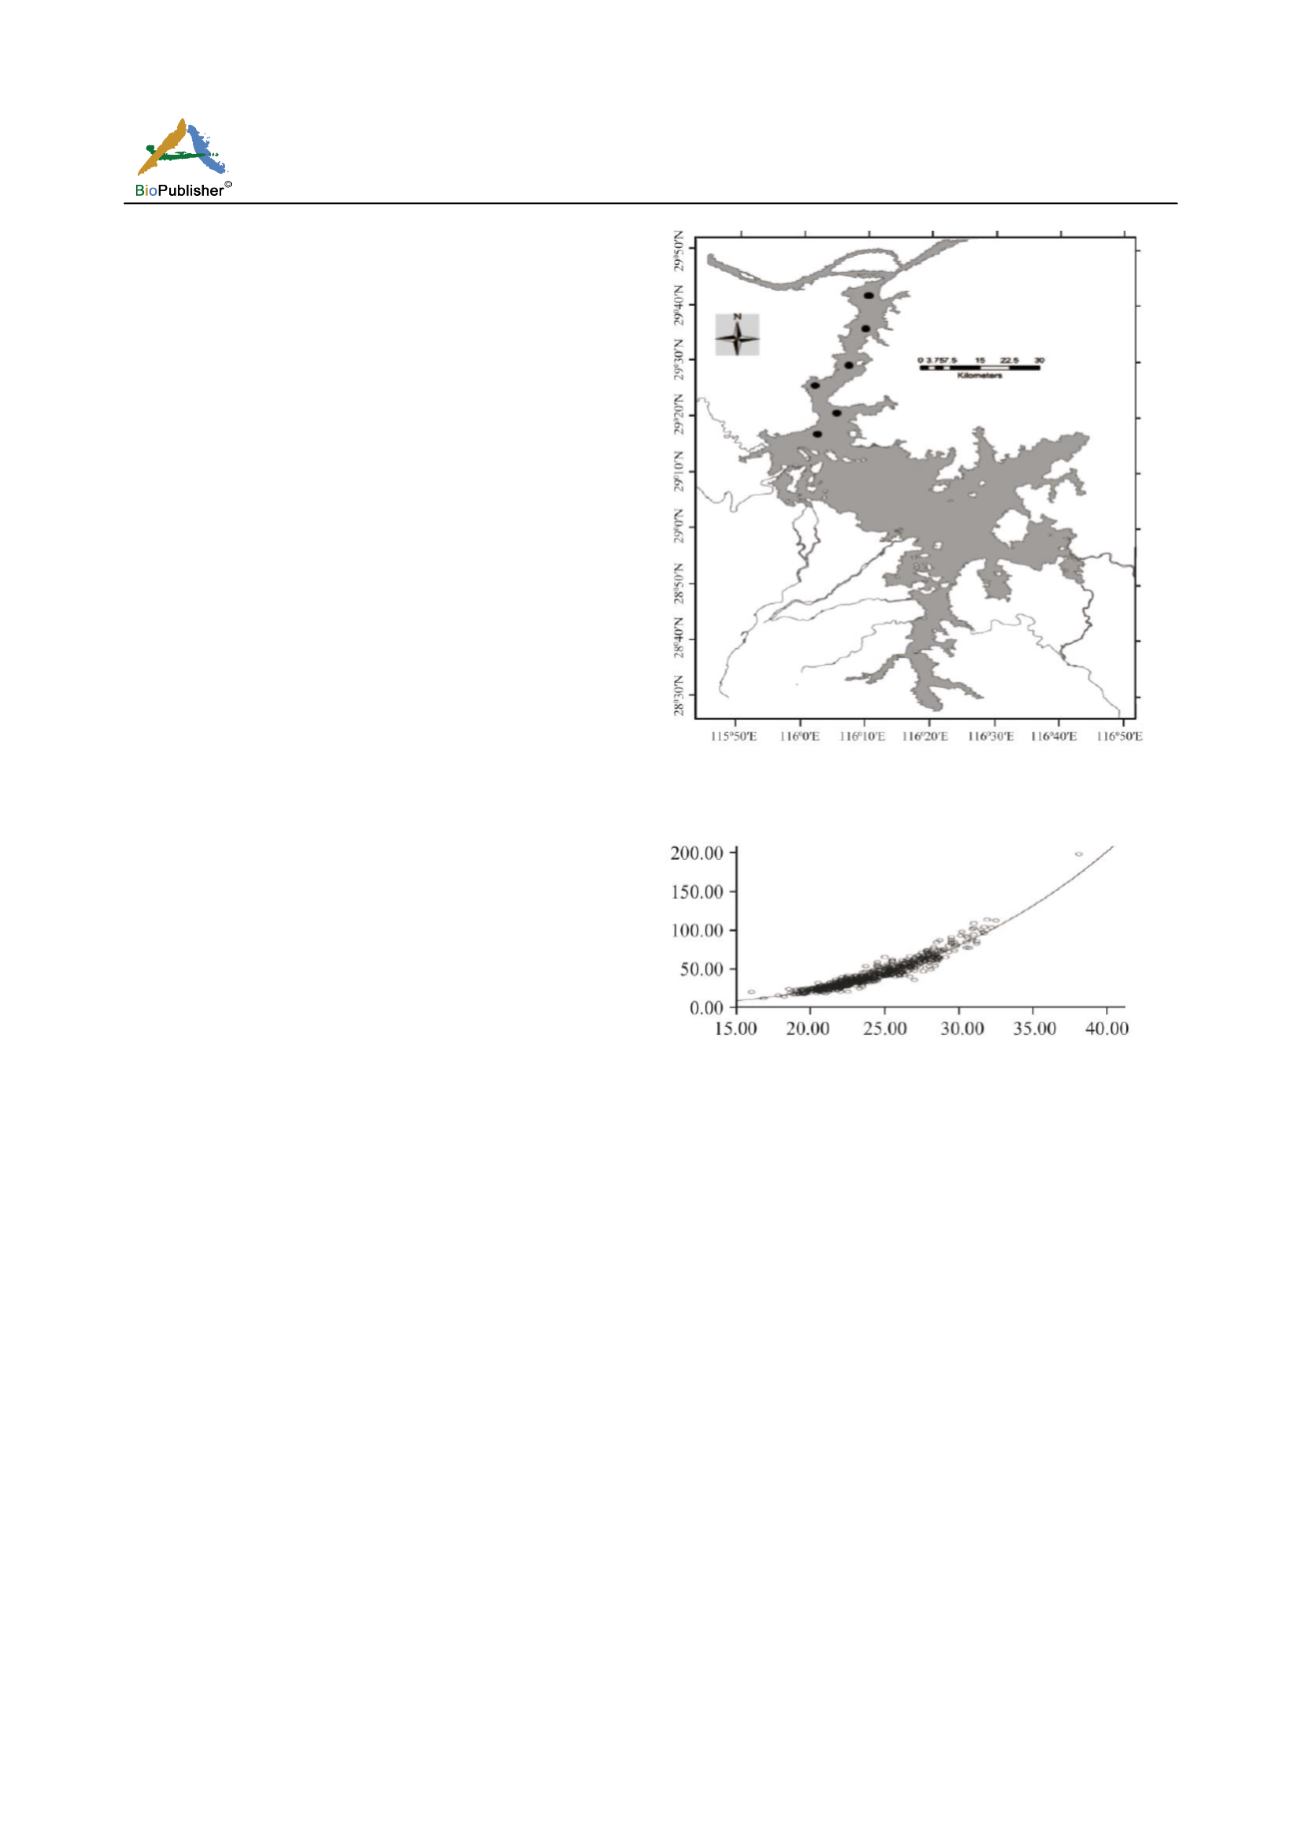
relationships were computed as body mass = 0.002×
body length
3.192
(R=0.958
;
p
<
0.05
;
n= 576), are presented
in fig.1. The parameters of the Von Bertalanffy growth
equation (VBGF) L∞ and K were estimated by running
the program ELEFAN included in the FiSAT package.
The monthly length-frequency distributions fitted with
growth curves by the program ELEFAN of FiSAT II,
are presented in fig. 2. This routine gave the L∞ =
40.95 cm and
k
= 0.25 year
-1
. This value found to be
the best combination of K and L∞ with the Rn at
0.532. This value further used to obtain the graph of
von Bertalanffy Growth Function (VBGF). The VBGF
of
C. nasus
illustrated in Fig. 2 indicated that the
origin of the growth curve starting in May for the
group of
C. nasus
. On annual basis, the growth of
C.
nasus
was described by the following Von Bertalanffy
growth equations: L= 40.95 ( 1 - e
- 0.250( t +1.025)
)
;
W =
280.12( 1 - e
- 0.250( t +1.025)
)
3
.
Pauly and Munro (1984) have indicated a method to
compare the growth performance of various fish stocks
was by computing Growth performance index(Ø′)=
log K + 2log L∞. Generally, Growth performance
index(Ø′) are species specific parameters, means that
their values are usually similar within related taxa and
have narrow normal distributions. We found Ø′=2.62
for
C. nasus.
Sparre and Venema (1992) stated that the
value of K= 1.0 is fast growth, K= 0.5 is medium
growth and
k
= 0.2 is slow growth. Hence,
k
=0.25, for
C. nasus
obtained from this study considered as an
slow growth.
3.3 Mortality coefficients
Mortality means the death of fish from the stock due
to fishing mortality or natural mortality includes
predation, disease and old age. Fishing mortality
assumed to be associated with physical injury or
physiological stress from being captured in the gear
used during capture. Natural mortality (M) and fishing
mortality (F) were additive instantaneous rates that
sum up to total mortality (Z). The total mortality
coefficient, Z= M + F (Gulland, 1971). When comparing
mortality rates to the total births or recruits to the
population, we can determine if a population is
increasing or decreasing.
The length-converted catch curve was used to determine
the value of natural mortality (M), fishing mortality (F)
and exploitation rate (E). The Z, M and F of
C. nasus
Figure 1. Location of study and landing areas for
C. nasus
in
the Poyang Lake through the Yangtze River Waterway (2014).
Figure 2 Length-Mass Relationship of
C. nasus
were estimated as 1.58 year
-1
, 0.54 year
-1
and 1.04
year
-1
, respectively.
C. nasus
in the Poyang Lake
through the Yangtze River Waterway showed high
mortality rates which related to fishing mortality and
natural mortality. The exploitation rate estimated to be
0.66 year
-1
. This value higher than 0.5 year
-1
, indicated
an overexploitation of
C. nasus
in the Poyang Lake
through the Yangtze River Waterway. Estimating
natural mortality (M) is one of the most difficult and
critical elements of a stock assessment(Hewitt et al.
1985). The Pauly’s Model by using growth parameters
is an indirect way of estimating natural mortality. It
assumes that there is a relationship between size and
natural mortality. Pauly’s original method was based
on the correlation of M with von Bertalanffy growth
parameters (K and L∞) and temperature.
3.4 Length at first capture (Lc)
The length at first capture, Lc of
C. nasus
was
estimated at 22.84 cm (Fig. 3). The Lc was the length


