Computational Molecular Biology 2015, Vol. 5, No. 4, 1-6
4
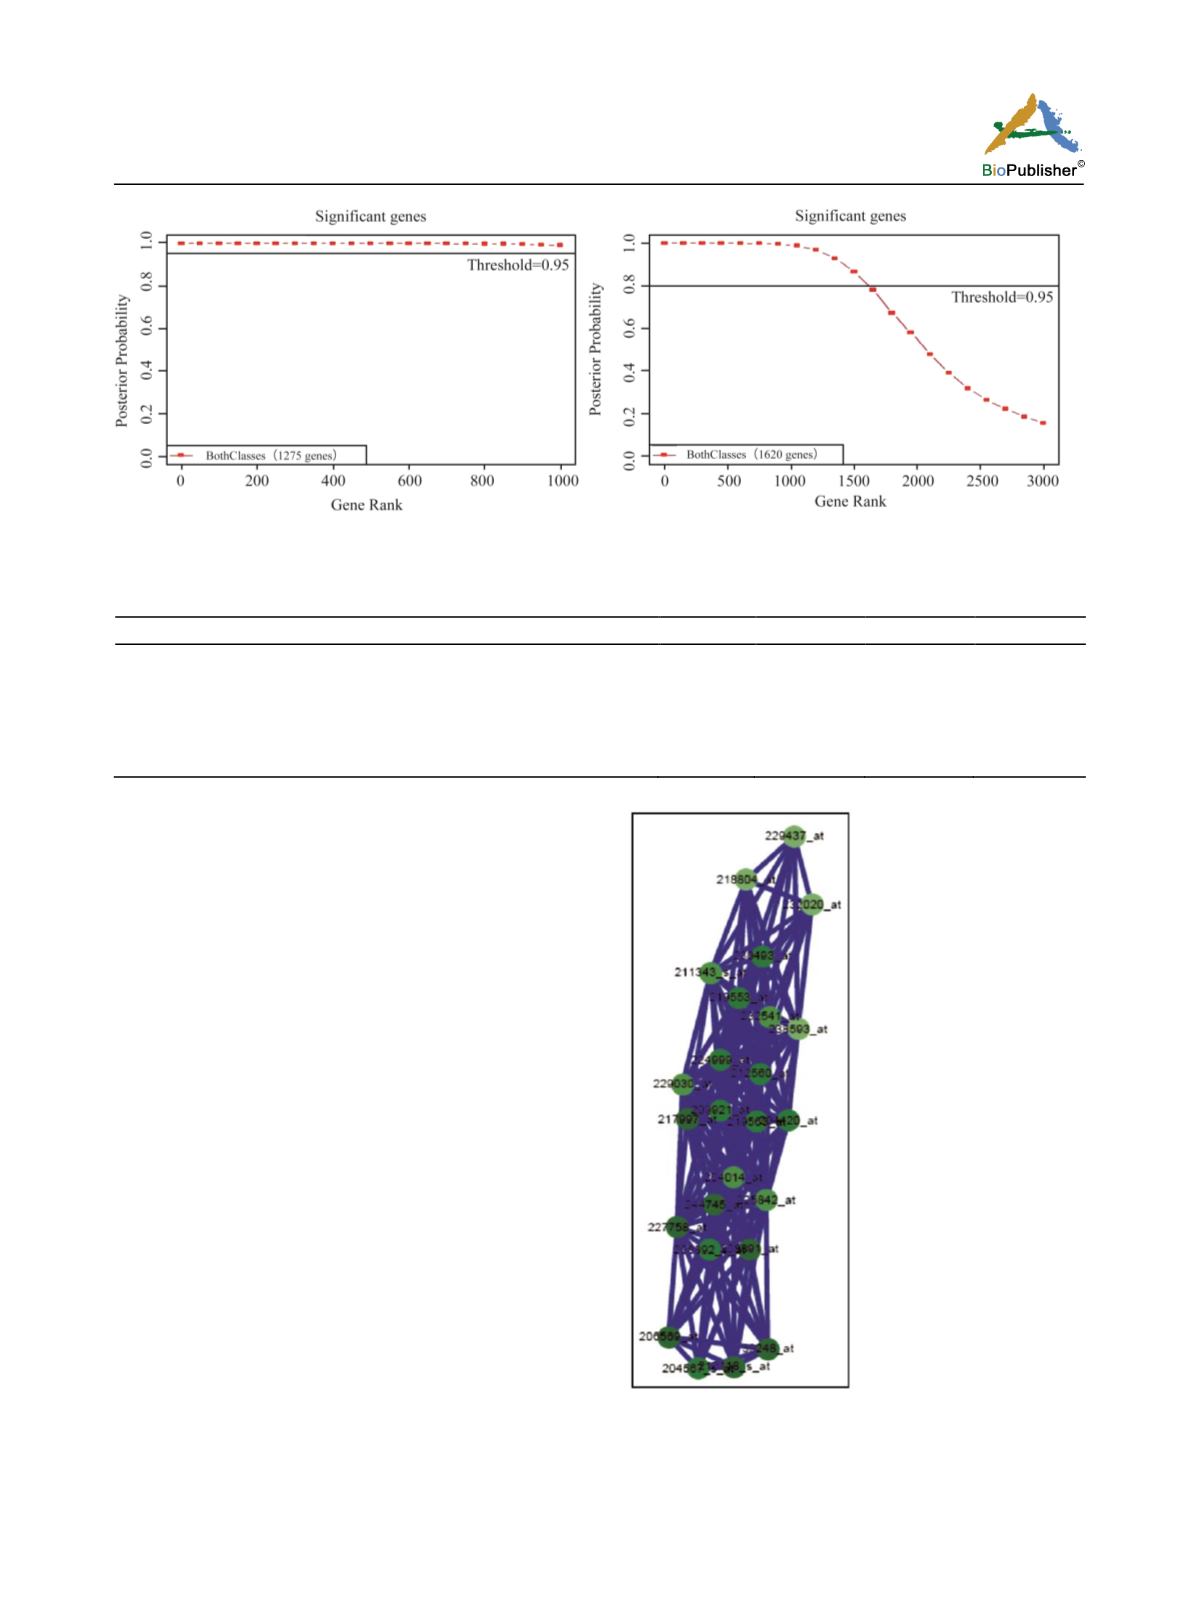
Figure 1 Significant genes of breast cancer cells that differentially expressed in disease and control tissues
Table 1 differentially expressed genes is significantly associated with genetic mutation of breast cancer
Genes
pValue
FDRB&H
FDRB&Y
Bonferroni
SHISA2, FBXO32, MMP7, FN1, CF1, EGR1, DCLK1
4.81E-10
9.85E-07
8.08E-06
9.85E-07
FBXO32, FN1, DCN, CF1, SERPINB3, SERPINB4, MAP3K4
1.30E-09
1.34E-06
1.10E-05
2.67E-06
ITGBL1, EBXO32, MMP7, FN1, DCN, CF1, OLFML3, MAP3K4
6.36E-09
4.35E-06
3.57E-05
1.30E-05
NPY1R, FN1, DCN, CF1, PHLDA1, EGR1, DCLK1
2.99E-08
1.53E-05
1.26E-04
6.13E-05
FBXO32, FN1, DCN, CF1, SERPINB3, SERPINB4
7.49E-08
3.07E-05
2.52E-04
1.54E-04
c ells and is used f or potential serum biomarkers
(table:1, 2) (Figure: 2).
B. Colon Cancer
Our analysis was done using 4 datasets of which 2
samples are HT29 parental cell lines and another two
samples are HT29RC PLX4720 resistant cell lines.
We have found 268 upregulated genes is consistently
expressed in HT29RC cell lines. There are 1268 down
regulated genes also associated with both cell lines
and control tissues. Using SVM classifier to differentia
more s ignificant genes of both conditions tha t
differentially expressed in colon cancer has 60 genes,
out of 60, 45 genes has protein expression these genes
is combines together with both upregulated and down
regulated within colon tissues (Figure: 3). We have
found 10 genes is generally expressed on blood serum
of colon tissues and is potentially us ed as a best
predicted biomarkers. Using functional annotation and
enrichment analysis of differentially expressed genes
shows that KRAS, DPT, PROM1, MMP1, MMP7,
FBN2, MAOB, SPRR3, PHLDB2, EMP1, DCLK1,
AKAP12 genes that regulate colon cancer (table: 3, 4).
Figure 2 Gene-gene interaction network predicted using
geNETClassifier on breast cancer data


