Cancer Genetics and Epigenetics 2015, Vol.3, No.13, 1-6
3
Table 1 the quantitative statistics of differentially methylated site
Expression level
Highly differentially
lowly differentially
High expression
78942
103567
Low expression
18504
73443
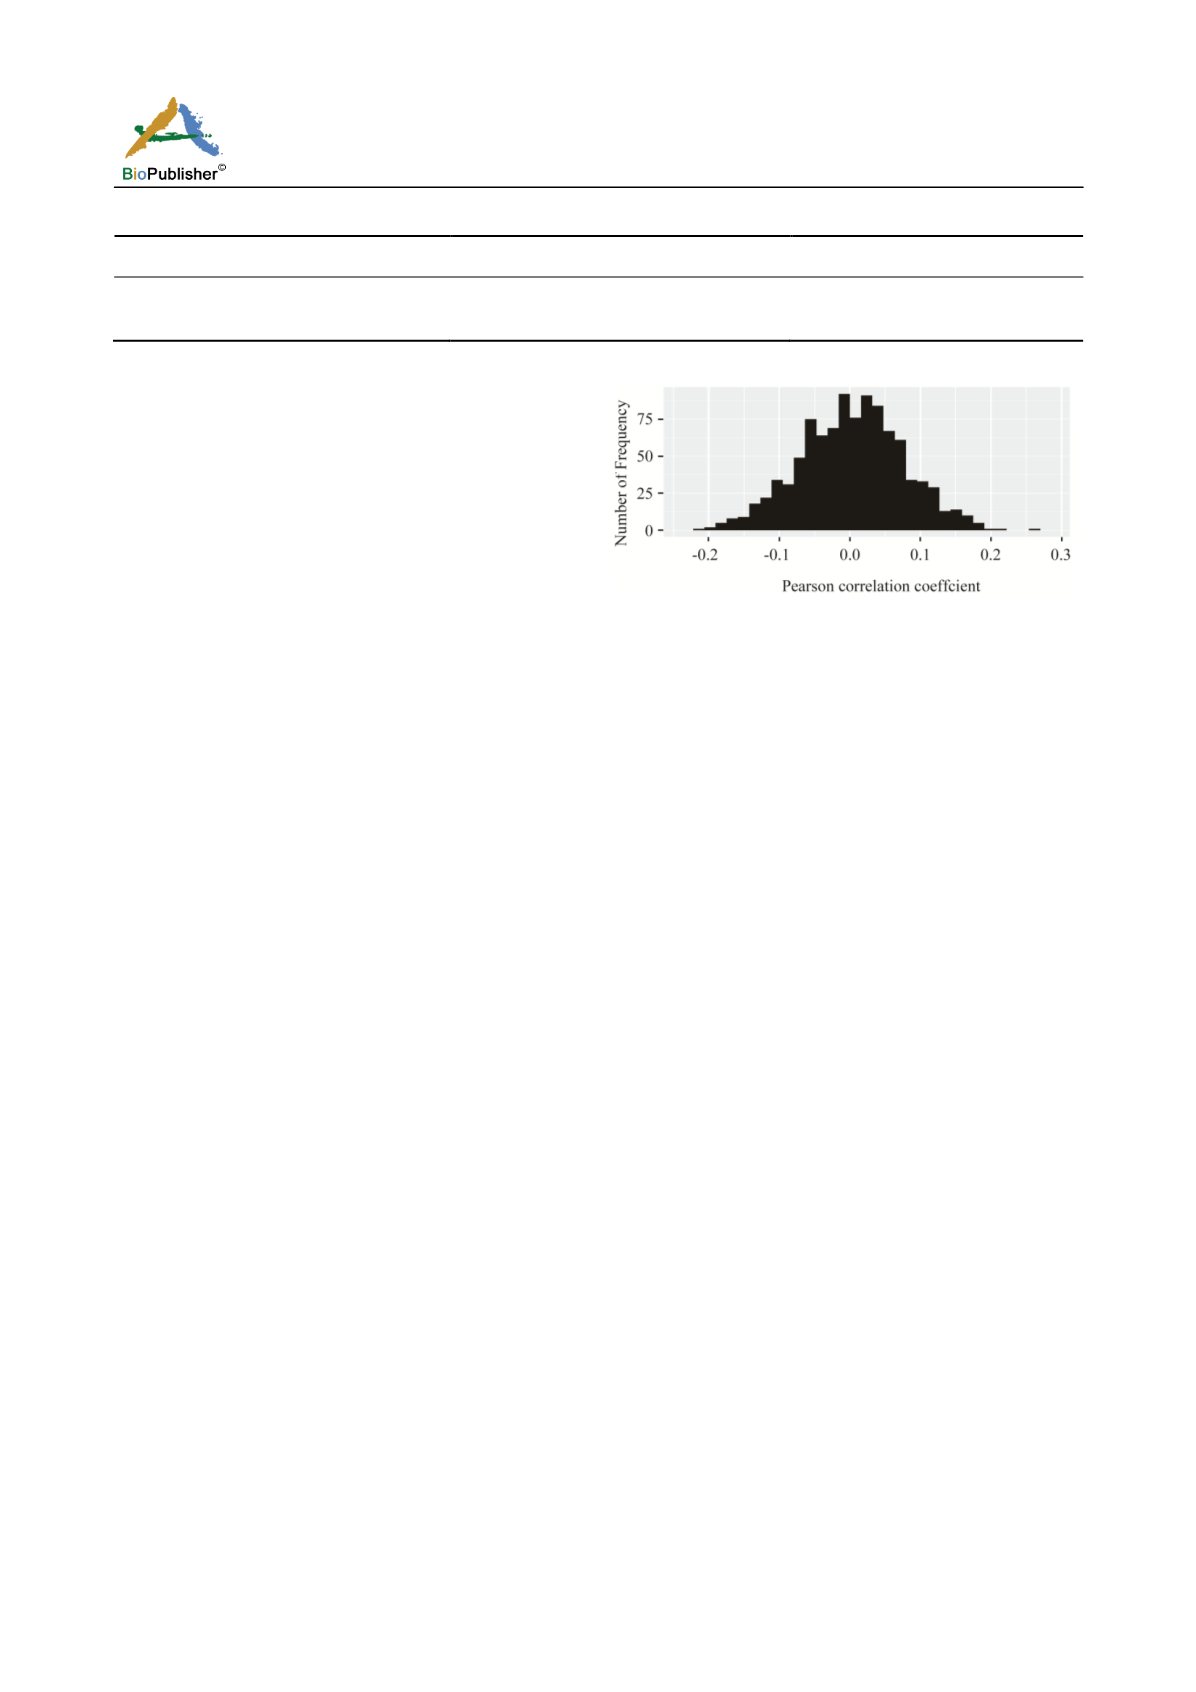
0.95 confidence interval of significantly correlative
DNA methylation sites. After 1000 times of random
perturbation, the distribution of correlation coefficients
followed Gaussian distributions (Figure 1).
We obtained 39970 and 62417 highly correlative
differentially DNA methylation sites in highly
differentially methylated group and lowly differentially
methylated group. Correspondingly, in the low
expression group, we obtained 6997 and 20300 highly
correlative differentially DNA methylation. The
correlation coefficient of each group had been show in
Figure 2-3. We could acquire that highly correlative
differentially DNA methylation sites in high expression
group were more than in low expression group.
2.4 Obtaining CpG sites in cis regulation region
In order to obtain the DNA methylation sites in the cis
regulation region, we get the chromosome coordinate
of each highly correlative differentially DNA
methylation sites. Because the IGFBP2 was on the
second chromosome between 216449551 and
217498127, we obtained the DNA methylation sites in
the region of 1Mb to the 216449551 (Table 2).
2.5 Survival analysis
These DNA methylation sites with 25 from h igh
expression group and 9 from low expression group
had been found in the cis regulation region, but we
were not sure if there really regulated the expression
of IGFBP2. Therefore, we analysed these DNA
methylation sites with the corresponding survival time
through cox regression analysis. The cg09410607 and
cg22954687 had been show significant correlation
with survival time. Then we plotted Kaplan-Meier
survival curve with the two DNA methylation site and
the survival time (Figure 4). We concluded that the
cg09410607 and cg22954687 could separate the
sample of long survival time and short survival time,
in addition, they could also regulate the expression of
IGFBP2. The p-value of the survival curve is 0.035.
3 Discussion
The overexpression of IGFBP2 has been observed in
Figure 1 The frequency map of Pearson correlation coefficient in
permutation 1000 times
many kinds of cancer, such as breast cancer, colorectal
cancer, neuroendocrine cancer, etc (Busund et al.,
2005; Mishra et al., 1998; Yazawa et al., 2009). It is
one of the most highly expressed IGFBPs in
neuroblastomas, glial tumors, and prostate cancers
(Menouny et al., 1997; Sallinen et al., 2000; Fuller et
al., 1999; Cindolo et al., 2007; Yazawa et al., 2009).
Mechanisms of its overexpression have been investigated
in many respects, but few are from the epigenetic field
(Yazawa et al., 2009).
This study investigated the epigenetic regulation of
the expression of IGFBP2. Through the differentially
DNA methylation analysis and the correlation analysis,
we obtained highly correlative DNA methylation sites
in the cis regulation region of IGFBP2, and they
significantly correlated with survival time.
The result showed that the high expression of IGFBP2
in cancer patients often indicated short survival time.
In the high expression group of IGFBP2, the
difference of DNA methylation state increased. On the
other hand, the expression of IGFBP2 was regulated
by epigenetic elements including cg09410607 and
cg22954687. The two DNA methylation sites could
significantly separate the sample of long survival time
and short survival time.
Acknowledgments
This work was supported by the Science Innovation Project
(grants 2015003) and the Innovation and Technology


