Bioscience Methods 2015, Vol.6, No.2, 1-7
4
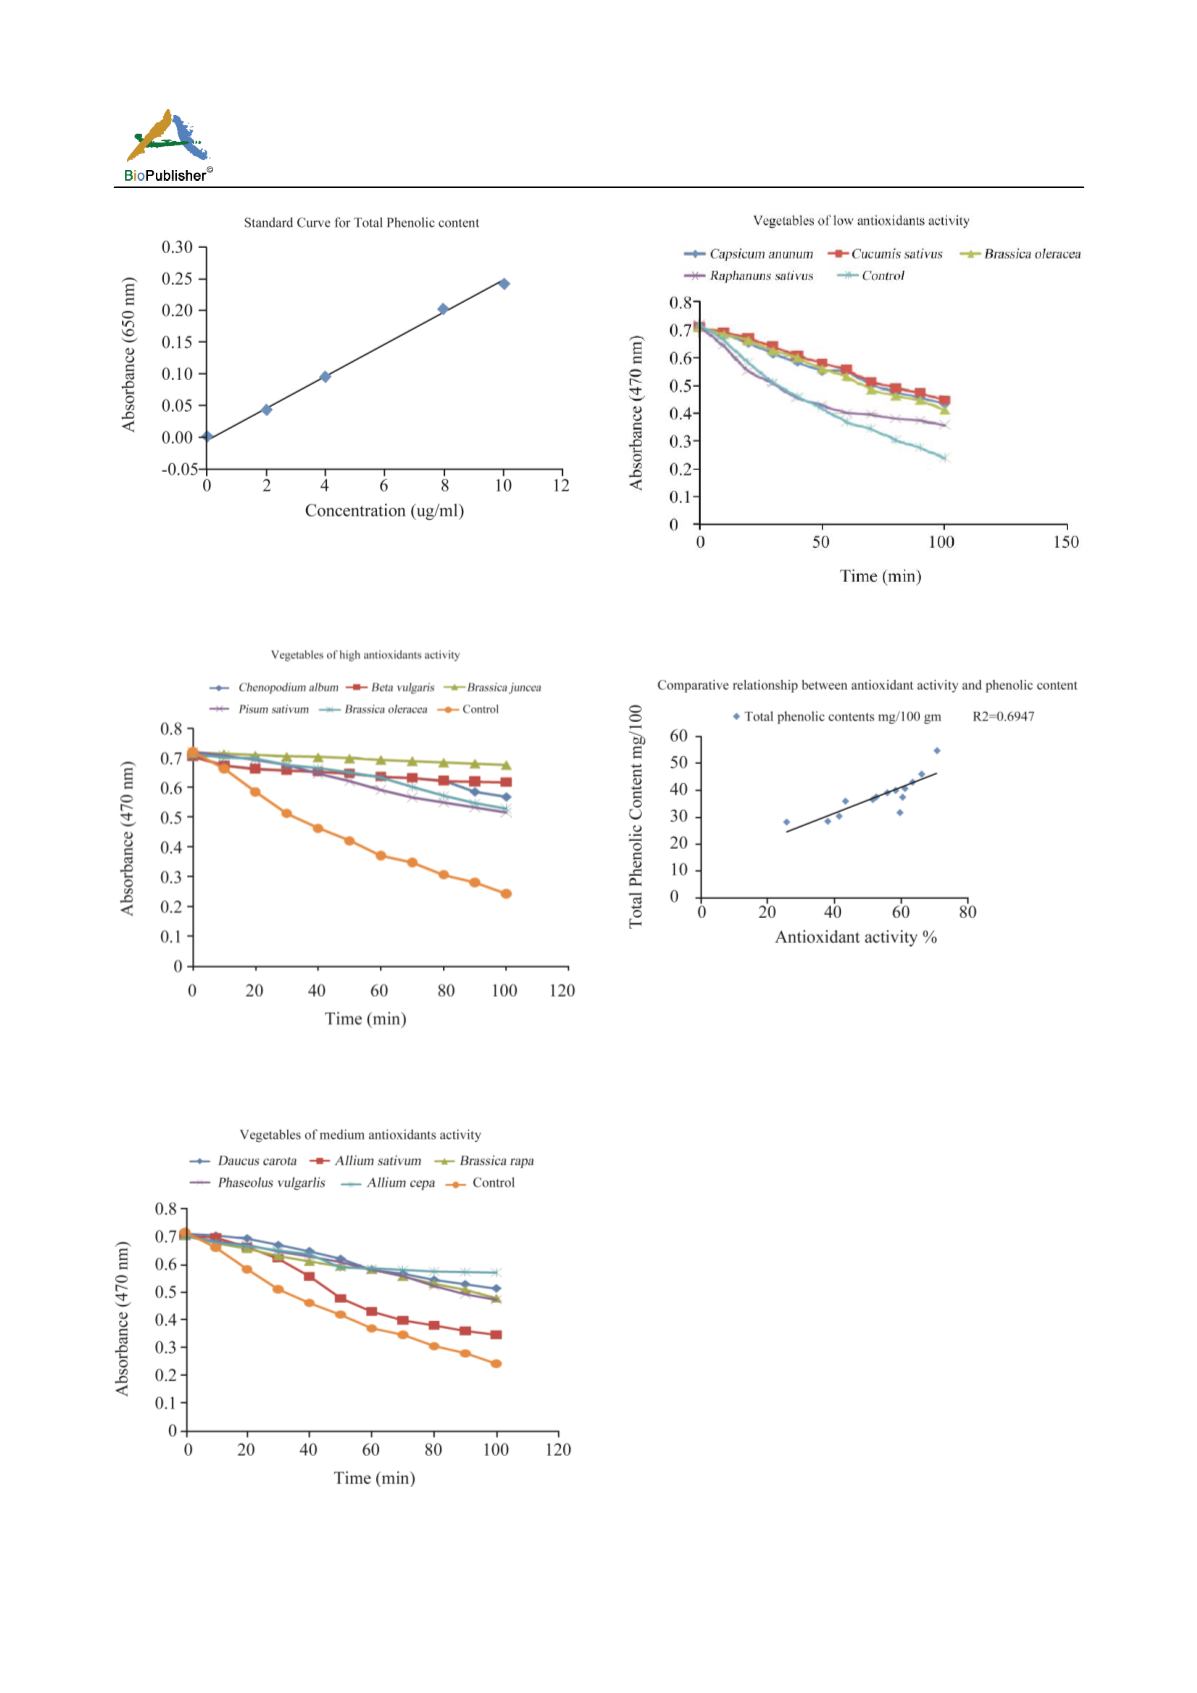
Figure 1 Graph representing the standard curve by using
catechol as a standard for calculating the total phenolic content
in vegetables samples
Figure 2 Anti-oxidant activity measured by bleaching of linoleic
acid-carotene emulsion (high anti-oxidant activity group)
Figure 3 Anti-oxidant activity measured by bleaching of linoleic
acid-carotene emulsion (medium anti-oxidant activity group)
Figure 4 Anti-oxidant activity measured by bleaching of
linoleic acid-carotene emulsion (low anti-oxidant activity group)
Figure 5 The relationship between total phenolic content and
anti-oxidant activity of vegetables
elation between total phenolic content and anti-oxidant
activity of the plant extracts. According to them
different phenolic compounds have different responses
in the Folin-Ciocalteu method. Similarly the molecular
anti-oxidant response of phenolics in methyl linoleate
varies remarkably depending on their chemical
structure (Anna et al., 2008). Thus the anti-oxidant
activity of an extract could not be explained just on
the basis of their phenolic content but also required
their proper characterization. Another Japanese study
used the Folin assay for fresh vegetable extracts and
measured their activity using β-carotene bleaching
coupled with the oxidation of linoleic acid (Tsushida
et al., 1994). They found a positive correlation of
anti-oxidant activity with phenol content. This correlation
suggests that although the vegetables may contain
other anti-oxidants such as proteins, ascorbate and the
carotenoids, these do not contribute significantly to the


