Basic HTML Version


Molecular Soil Biology
19
statistically between the amounts of pH, organic
carbon, total nitrogen, C/N, moisture and bulk density
in different types (Table 2). The greatest amount of pH
recorded for alder in contrast to natural or the other
sorts of forestations. Also the most amount of pH was
seen in the second depth (10~20 cm). Organic carbon
in Cypress forestation was the most to the other
planted stacks besides there was a significant
difference between two aforementioned depths (Table
3). Alder and maple had the greatest nitrogen in
contrast to Cypress, poplar and natural forest, so that
deeper goes down, less in number. C/N in Cypress
mass showed a significant difference to the other
planted types, although not any differences in both
depths. The greatest amount of humidity was seen in
broad-leaved species (alder, maple and poplar) to
Cypress and natural types. Moreover in depth of 0~10
cm the humidity was significantly different from
10~20 cm. The greatest amount of bulk density was
seen in Cypress, as well in the second depth.
Table 2 Comparison mean of soil physico-chemical properties in different types
Types
Moisture (%)
C/N
Total nitrogen (%) Organic Carbon (%) pH
Bulkdensity(g/cm
3
)
Cupressus
29.72 (±0.52)
b
20.44 (±0.43)
a
0.18 (±0.00)
c
3.73 (±0.07)
a
6.52 (±0.00)
c
1.30 (±0.01)
a
Populus
31.67 (±0.50)
a
7.75 (±0.73)
d
0.20 (±0.01)
b
1.63 (±0.19)
d
7.16 (±0.07)
a
1.14 (±0.00)
a
Maple
31.53 (±0.45)
a
10.96 (±0.25)
c
0.28 (±0.00)
a
3.09 (±0.03)
bc
6.47 (±0.01)
c
0.99 (±0.00)
c
Cypress
31.69 (±0.59)
a
10.20 (±0.33)
c
0.27 (±0.00)
a
2.84 (±0.11)
c
6.33 (±0.00)
c
1.03 (±0.01)
b
natural forest
26.86 (±1.02)
c
15.28 (±0.66)
b
0.21 (±0.00)
b
3.29 (±0.10)
b
6.68 (±0.07)
b
1.05 (±0.01)
b
Note: In each column there is not seen any significant difference between averages amounts with at least one common letter between
Table 3 Comparison mean of soil physico-chemical properties in 2 different depths
Depth(cm)
Moisture (%)
C/N
Total nitrogen (%)
Organic carbon (%)
pH
Bulkdensity(g/cm
3
)
0~10
a
(0.46±)31.59
a
(0.88±)12.91
a
(0.00±)0.25
a
(0.130±)3.12
b
(0.02±)6.39
b
(0.02±)1.08
10~20
b
(0.50±)29.00
a
(1.04±)12.95
b
(0.00±)0.21
b
(0.170±)2.72
a
(0.03±)6.68
a
(0.02±)1.12
Note: In each column there is not seen any significant difference between averages amounts with at least one common letter between
1.3 Macrofauna biodiversity and soil features
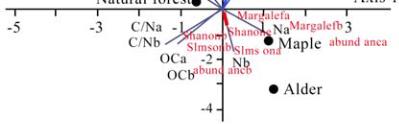
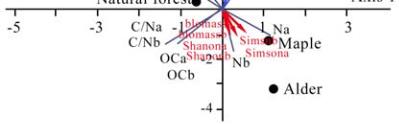
The first and second principal components (PC1) and
(PC2) maximized a total of 85.75% of the variance in
the data set (Figure 5 and Figure 6). The eigenvectors
for total nitrogen in both of depths are greatest in
relation to Alder and Maple types whereas the
character of bulk density is lowest compared to the
eigenvectors of other variables (Figure 5 and Figure 6).
Whole of macrofauna biodiversity indices (for both of
abundance and biomass) are tended to Alder and
Maple types (Figure 5 and Figure 6).
Figure 5 PCA biplots of forest types, abundance biodiversity
and soil features
Note: PC1: Eigen value = 5.41, percent of variance = 45.09,
cumulative variance percent = 45.09 and PC2: Eigen value = 4.87,
percent of variance = 40.65, cumulative variance percent = 85.75
Figure 6 PCA biplots of forest types, biomass biodiversity and
soil features
Note: PC1: Eigen value = 5.41, percent of variance = 45.09,
cumulative variance percent = 45.09 and PC2: Eigen value =
4.87, percent of variance = 40.65, cumulative variance percent
= 85.75
2 Discussions
According to forest destruction raise, using native
species in forestation is a suitable procedure to revive
destructed and ruined forest. To choose a type, not
Molecular Sil Biology