Basic HTML Version


Journal of Tea Science Research 2013, Vol.3, No.1, 1-6
http://jtsr.sophiapublisher.com
2
resulting from its symmetrical triacylglycerol species
(TAGS, more than 85% of POP, POS and SOS), it is
one of the most important ingredients in chocolate
formulations (Foubert et al., 2003; Khan and
Rousseau, 2006). As only a few countries cultivate
cocoa beans, the price of CB is one of the highest
among all commercial fats and oils. Therefore,
industries are looking for CBRs (Zaidul et al., 2006;
Liu et al., 2007). In recent years, enzymatic
production of CBRs from lower value fats or oils is
the subject of many investigations (Khumalo et al.,
2002; Kurvinen et al., 2002; Osborn and Akoh, 2002;
Abigor et al., 2003).
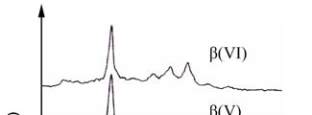
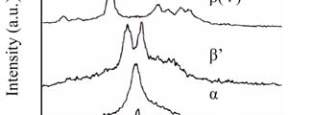
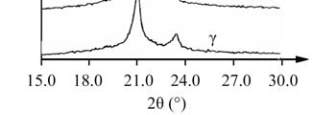
Figure 1 X-ray diffraction patterns of various cocoa butter
phases (Schenk and Peschar, 2004)
Tea seed (
Camellia sinensis
), containing 30%~32%
high quality oil, is known as a by-product in Iran.
Therefore, in the first part of the study, tea seed oil
was modified by enzymatic interesterification to
produce a structured lipid that would be suitable for
use as a CBR in the dark chocolate.
The aim of the second part of the study is to show the
effect of CBR at various replacement levels of CB
(10%, 15% and 20%) on crystalline forms and fat
bloom formation in chocolate samples.
1 Results and Discussion
The results of determining TAGS of SF, EICH, and
CB are shown in Table 1. According to the results
obtained, among major TAGSs of CB (POS, SOS and
POP), only SOS with the amount of 0.14% was found
in SF. However, after enzymatic interesterification,
not only the amount of SOS increased from 0.14% to
11.15% but also the percentages of 17.42% and
10.73% were observed for POS and POP, respectively.
Furthermore, m.p. of EICH was comparable to that of
the CB. Therefore, EICH was used in chocolate
formulation as a CBR at the levels of 10%, 15% and
20% to study the fat bloom formation and
polymorphic structure.
Table 1 Tags (percent) of SF and EIS in comparison with CB
TAGS (percent)
SF
EIS
CB
PLP
29.16 ± 0.02
a
3.19 ± 0.07
b
1.66 ± 0.02
c
OOO
20.71 ± 0.01
a
14.82 ± 0.04
b
0.62 ± 0.04
c
PLS
ND
*
6.30 ± 0.42
a
2.21 ± 0.02
b
POP
ND
10.73 ± 0.04
b
17.48 ± 0.02
a
SOO
ND
4.81 ± 0.13
a
1.86 ± 0.01
b
POS
ND
17.42 ± 0.06
b
43.18 ± 0.07
a
SOS
0.14 ± 0.04
c
11.15 ± 0.07
b
29.92 ± 0.12
a
Others
49.99 ± 0.15
a
31.58 ± 0.21
b
3.09 ± 0.02
c
Melting point (
℃
)
ND
32.23 ± 0.25
31.43 ± 0.12
Note: Each value in the table represents the mean ± S.D. of triplicate analysis. Different letters within rows indicate significant
statistical differences at P < 0.05.
a
SF: solid fraction; EIS: enzymatically interesterified sample; CB: cocoa butter;
b
TAGS:
triacylglycerol species; P: palmitic acid; S: stearic acid; O: oleic acid; L: linoleic acid;
*
ND: not detected
The WI values, as bloom formation index, are plotted
versus days of cycling in Figure 2. This result shows
that the SFC of EICH, in all temperature conditions,
was lower than that of the CB (Table 2). This is
probably due to higher content of triolein (OOO) and
some other TAGSs (PLP, OOO, PLS and SOO) in the
sample compared with those of the CB (Table 1).
Therefore, increasing the level of EIS from 10% to
20% in chocolate formulation enhances the rates of fat
bloom formation (Figure 2). Several studies also have
shown that an increase in liquid fat content (decrease
in SFC) and the presence of TAGSs incompatible with
those of the CB, increasing the fat bloom formation
markedly on the chocolate surface (Ali et al., 2001;