Basic HTML Version


R
elationship SSR-Based Molecular Marker Cotton F
1
Inter Specific Hybrids Performance Seed Cotton Yield
24
Mohammadi et al. (2008) investigated the correlation
between the potential of molecular markers and
hybrids performance in Maize. Significant correlation
was found between GD value of parental lines and
hybrid performance for the testcross and diallel data.
In diallel analysis significant correlation was observed
between total grain yield per ear (TGW) and genetic
distance based on SM coefficient, whereas the
correlation of GD and specific combining ability of
hybrids for this trait was not. Through the stepwise
multiple regression analysis a total of 19 informative
SSR markers distributed over all chromosomes,
except chromosomes 7 and 8, were detected. GD
values based on informative markers in general were
grater compared to that of based on all markers and
significant improvement was observed in the
correlations between GD estimates based on
informative markers and TGW as well as SCA.
The objectives of the present study were 1- To
investigate the relationship of genetic distance, based
on SSR markers, with hybrid performance and
heterosis and to determine whether these markers
would be useful for predicting hybrid performance
and heterosis in cotton. 2- To improve the yield and
fiber quality using interspecific hybridization
(
G.hirsutum
×
G. barbadense
) in cotton.
1 Results and Discussion
1.1 Marker polymorphism
Analysis of microsatellites (SSR’s) in 32 parents (28
barbadense lines and 4 hirsutum testers) using 40
primers. Of these, 23 primers revealed a high DNA
polymorphism among parents, these 23 primers
produced a total of 134 amplified profiles (Table 1
)
.
Among these, 93 were polymorphic with an average
of 68.65 per cent polymorphism. Primers viz., BNL
3871, BNL 3867 and BNL 1611 gave highest (100%)
polymorphism. The number of bands ranged from two
(BNL 3871, BNL 1034, BNL 1227 and BNL 3867) to
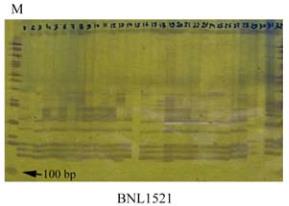
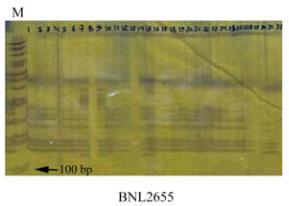
ten (BNL 2655, BNL 3145, BNL 1440, BNL 3171 and
BNL 3994) with an average of 3.35 bands per primer.
The primers viz., BNL 1034, BNL 1227, BNL 1059
and CIR 246 showed the least polymorphism (50%).
DNA amplification pattern of 32 parents is shown in
Figure 1.
Figure 1 DNA amplification pattern of 32 parents genotypes
Table 1 Analysis of SSR patterns generated using 40 primers in cotton genotypes
No of bands
Sl. No.
SSR name
Total
Monomorphic
Polymorphic
Polymorphism
1
BNL3627
0
0
0
0
2
BNL3147
0
0
0
0
3
BNL2921
0
0
0
0
4
BNL4082
0
0
0
0
5
BNL3871
2
0
2
100
6
BNL1034
2
1
1
50
7
BNL1227
2
1
1
50
8
BNL341
0
0
0
0
9
BNL1231
0
0
0
0
10
BNL1878
0
0
0
0
Genomics and Applied Biology