Basic HTML Version


International Journal of Marine Science 2015, Vol.5, No.7, 1-4
http://ijms.biopublisher.ca
2
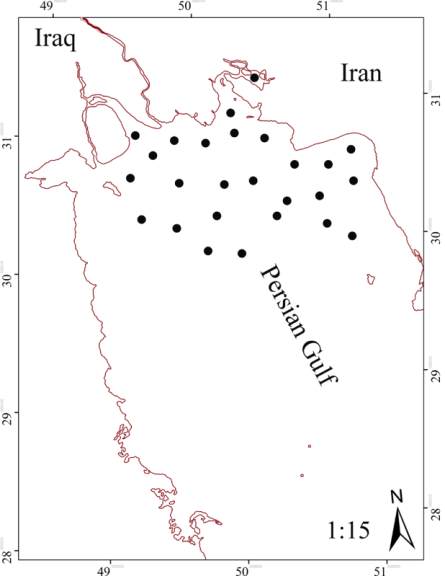
Figure 1 Studied area and fishing vessels locations
Simpson index
Simpson index is based on the number of species in
sample. Using this index in fishing requires to change
basis of measurement from the number to biomass
(Goda and Matsuoka, 1986; Gupta, 2010).
Accordingly, The Simpson index (biodiversity)
represented is:
Y
it
is the catch of species “i” at the time of “t”, Y
t
is
the total of catch during “t” period and “S” is the
number of species caught during “t” period. In 2010,
Gupta introduced a modified formula of Simpson
index to exploit commercial fish that the values of
each commercial fish were defined. Indeed, demand
rate and fish price are the coefficient to valuing of
these species. The equation is:
TR = Σ P
i
Y
i
In this equation P
i
, is valuation coefficient of
species ”i”; “TR”, is value of total species and “B” is
bio-economy diversity index.
2 Results
When the economic value of total species is similar
together, the economic diversity index is equal to
bio-diversity index (Table 1). If the population of total
catch belongs to commercial species, the economic
diversity index is larger than bio-diversity index and
vice versa. Analyzed colors for three experimental
nets were white, blue, and green. Three mesh sizes
3.75, 6 and 10 cm (STR) were also examined. Total
catch of experimental nets were 25794.15 kg during
sampling period that were valued in terms of demand
and market price (Table 3).analysis of diversity index
showed that white net and green net had lowest and
highest efficiency respectively. Mesh with 10 cm
(STR) and 3.75 cm (STR) also had maximum and
minimum efficiency (Table 1 and 2). Catch rate and
trapped species have been shown in Figures 2 to 7.
Table 1 Sipmson and Economic diversity index in nets with
different colors
Index
White Net
Green net Blue Net
Simpson Index
0.507
0.142
0.170
Economic Diversity 0.437
0.212
0.173
Table 2 Sipmson and Economic diversity index in nets with
different mesh sizes
Index
3.75 cm (STR) 6 cm (STR) 10 cm (STR)
Simpson Index
0.507
0.234
0.116
Economic Diversity 0.427
0.223
0.163
Table 3 species caught with gillnets during sampling period
(2008-2009)
Scientific Name
Family
Market Value
based on 10
Ilisha
spp
Clupeidae
3
Otolithes ruber
Sciaenidae
9
Scomberomorus
commerson
Scombridae
10
Acanthopagrus
spp
Sparide
6
Platicephalus indicus
Platycephalidae
4
Chirocentrus
spp
Chirocentridae
6
Scomberomorus guttatus
Scombridae
10
Pampus
argenteus
Stromateidae
10
Cynoglossus
spp
Cynoglossidae
6
Pomadasys kaakan
Haemulidae
8
Polynemus
spp
Polynemidae
8
Pnnahia macrophthalmus
Sciaenidae
6
Sphyraena
spp
Sphyraenidae
6
Euthynnus affinis
Scombridae
9
Parastromateus niger
Carangidae
5
Tenualosa ilisha
Clupeidae
8
Scylla
spp
Portunidae
3
Arius
spp
Ariidae
1
Random Families
Carcharhiniformes
3
Random Families
Myliobatiformes
1
Random Families
Cnidaria
-1
Others
-
2