Basic HTML Version


International Journal of Marine Science 2014, Vol.4, No.72, 1-7
http://ijms.biopublisher.ca
5
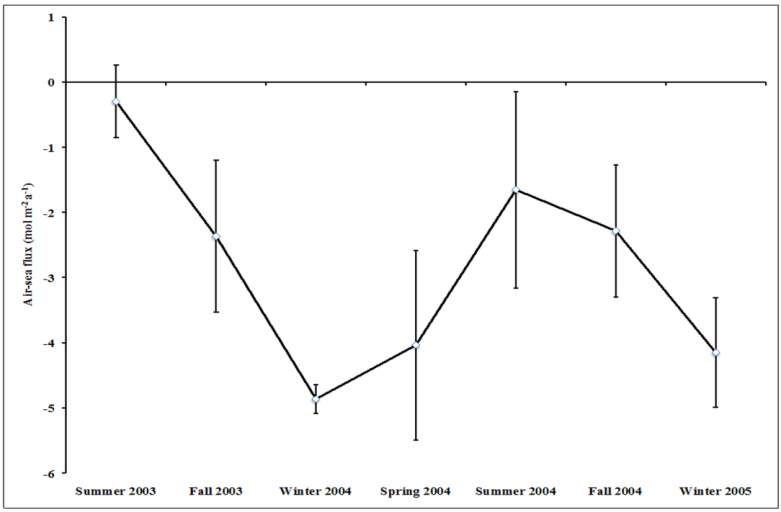
Figure 4 Interseasonal average air-sea CO
2
fluxes at PAP time series site (49
o
N, 16.5
o
W) between July 2003 and March 2005
approximates to annual CO
2
sink estimates of 2.06 ±
2.13, 3.21 ±1.60 and 3.73 ±0.84 mol m
-2
CO
2
a
-1
for
the 2003, 2004 and 2005 deployments respectively. A
net CO
2
uptake flux during the 2nd to 4th
deployments is estimated to be -2.96 ±1.73 mol m
-2
CO
2
a
-1
, indicating a perennial sink for the Northeast
basin. However, a significant difference influx on an
interseasonal timescale took place during the
wintertime, which witnessed a net invasion (strong
sink) of CO
2
compared to a moderate sink during the
summertime.
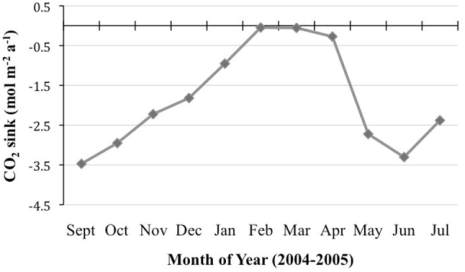
The monthly air-sea CO
2
fluxes for the K1 CELAS
observatory (56.5
o
N, 52.6
o
W) calculated based on
observational data obtained between September 2004
and July 2005 is shown in Figure 5. The spatially
monthly averaged air to sea fluxes indicate an
oceanographic system that is perennially sequestering
atmospheric CO
2
except in the peak of the wintertime
(February/March 2005), when an estimated uptake of
approximately 0.05 mol m
-2
CO
2
a
-1
invaded the
seawater system, implying a relatively weak sink.
During wintertime, surface water
p
CO
2
approached
equilibrium with atmospheric CO
2
. Overall, a net CO
2
uptake flux during the K1 CELAS SAMI deployments
is estimated to be -1.84 ±1.3 mol m
-2
CO
2
a
-1
, with a
significantly strong sink capacity of 3.5 mol m
-2
CO
2
a
-1
obtained during late summer of 2004.
Figure 5 Monthly air-sea CO
2
fluxes at Northwest K1 CELAS
time series site
However, the monthly air-sea CO
2
fluxes at the PAP
time series site indicate a temperature dependence on
the flux variability. This is an indication that the
fluxes are controlled by
in situ
SST as suggested by
the near-linear correspondence between monthly
average SST and monthly average flux at the site
(Figure 6). In the same way, to elucidate the
mechanism that drives the monthly flux variability,
which in turn influences the surface oceanic carbon
cycle at the K1 CELAS site, a linear plot between
CO
2
fluxes and SST is presented in Figure 7. The
air-sea fluxes variability as shown by the
non-dependence relationship between monthly average
flux and SST reveals that the exchange is not entirely
dominated by temperature- induced
p
CO
2
-sw.