Basic HTML Version


International Journal of Marine Science 2014, Vol.4, No.50, 1-22
http://ijms.biopublisher.ca
7
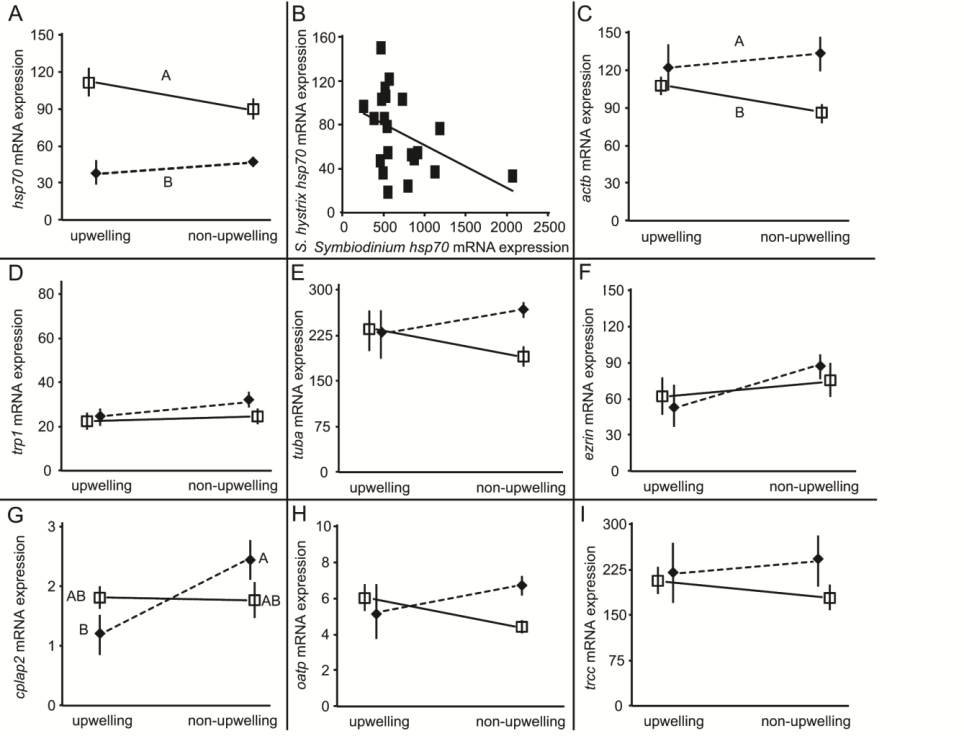
Figure 5 VTE: host coral gene expression. Expression of eight host coral genes;
hsp70
(A),
actb
(C),
trp1
(D),
tuba
(E),
ezrin
(F),
cplap2
(G),
oatp
(H), and
trcc
(I), and correlations in
hsp70
expression within the holobiont (B) in
Seriatopora hystrix
nubbins from
Houbihu (“upwelling” site [UWS]) or Houwan (“non-upwelling” site [NUWS]) exposed to either a stable (hollow squares of panels
A and C-I) or variable (filled diamonds of panels A and C-I) temperature for seven days. Please see the text or Tables A1-3 for full
gene names. Gene expression data were normalized as described in the text and presented as unit-less. Error bars represent standard
error of the mean (
n
=3 replicates [6 pseudo-replicates] per treatment-site of origin). In panels A and C, letters adjacent to icons
correspond to Tukey’s honestly significant difference (HSD) temperature treatment groups only (
p
<0.05), while letters adjacent to
icons in panel G correspond to the interaction effect of site of origin and temperature treatment (Tukey’s HSD,
p
<0.05).
With respect to the host coral genes,
actb
was
expressed at similar levels between sites (Wilcoxon
Z
=0.20,
p
=0.84). On the other hand,
trp1
was
expressed at 41-fold higher levels in corals of the
UWS (
Z
=3.0,
p
<0.01), and
tuba
was expressed at
2.3-fold higher levels in those from the NUWS (
Z
=3.5,
p
<0.001).
ezrin
and
cplap2
were expressed at
significantly higher (9.4 and 320-fold, respectively)
levels in samples from the UWS relative to those from
the NUWS (
Z
=2.6 and 2.8,
p
=0.01 and <0.01,
respectively), as was
oatp
(140-fold difference;
Z
=2.3,
p
<0.05, though see caveats in caption for Figure 6).
The osmoregulation gene
trcc
was expressed at
3.1-fold higher levels in corals from the UWS (
Z
=2.3,
p
<0.05). Finally, the host molecular chaperone
hsp70
was expressed at significantly lower (1.8-fold) levels
in corals from the UWS relative to those of the
NUWS (Wilcoxon
Z
=2.5,
p
<0.05). Although 7/14
(50%) of the genes were more highly expressed in
samples from the UWS versus only 3/14 (21%) of the
genes demonstrating higher expression in samples
from the NUWS, this difference in proportions was
not statistically significant (
X
2
=2.5,
p
=0.11).