Basic HTML Version


International Journal of Marine Science 2014, Vol.4, No.35
http://ijms.biopublisher.ca
9
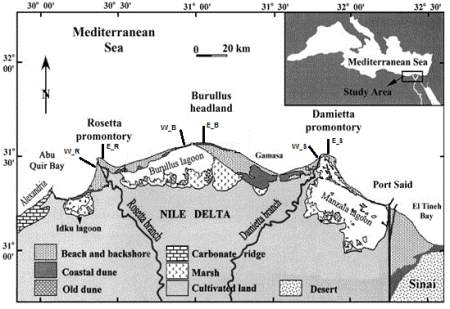
Figure 8 Nile Delta and sampling locations (modified from Frihy et al., 2003). W_R = West Rosetta, E_R = East Rosetta, W_B =
West Burullus, E_B = East Burullus, W_S = West Ras El-Bar and E_S = East Ras El-Bar
For radioactivity measurements, about 2.25 g of
sediment sample materials were grind and homo-
genized with a small marble mortar. The samples were
stored in cylindrical plastic containers with a 1.0 cm
diameter that fits into a germanium well detector for
gamma spectrometry. Each sediment sample was
covered by >1 cm layer of epoxy to isolate it from air
to ensure that the radon gas is confined within the
volume. Each sample was carefully sealed for four
weeks to ensure secular equilibrium between
226
Ra
and
222
Rn.
3.3 Gamma spectrometric analysis
Activity measurements were performed by using a
well type high-resolution gamma-ray spectrometer
with hyper-pure germanium (HPGe) detector. All the
radioactivity measurements and its calculations were
carried out at the main laboratory of the
Environmental Radioactivity Measurement Facility,
Department of Earth, Ocean and Atmospheric
Sciences, Florida State University, USA. In order to
reduce gamma-ray background, the detector is
shielded by a cylindrical 10 cm lead shield. The
accumulation counting time of activity or background
ranged from 25 to 71 hours. The
226
Ra activities (or
238
U activities for samples assumed to be in
radioactive equilibrium) were estimated from the
gamma transition lines of
214
Pb (295 and 351.9 keV)
and
214
Bi (609.3 keV). The gamma ray energies of
228
Ac (338.4 and 911.2 keV) and
208
Tl (583.1 keV)
were used to estimate the concentration of
232
Th. The
activity concentrations of
40
K were measured directly
by its own gamma ray (1460.8 keV). The activity
concentrations were calculated from the intensity of
each line taking into account the mass of the sample,
the branching ratios of the gamma-decay, the time of
counting and the efficiencies of the detector. The
background spectra were used to correct the net peak
area of gamma rays of measured isotopes. Efficiency,
background in CPM and minimum detectable activity
(MDA) in dpm/g are listed in Table 3 for all energies
used in this investigation.