Basic HTML Version


International Journal of Marine Science 2014, Vol.4, No.18: 166-178
http://ijms.sophiapublisher.com
171
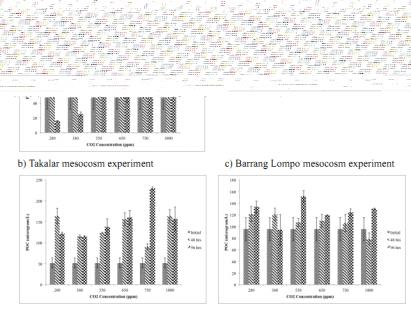
Figure 4 Mean of POC (X ± SE) at six CO
2
concentration treatments for two incubation periods. a) Barru mesocosm experiment, b)
Takalar mesocosm experiment and c) Barrang Lompo Island mesocosm experiment.
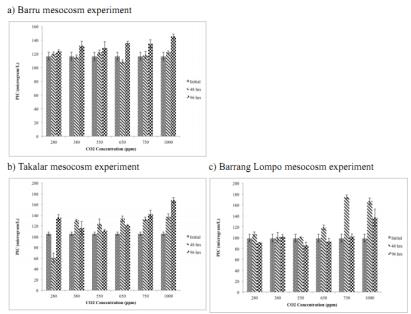
Figure 5 Mean of PIC (X ± SE) at six CO
2
concentration treatments for two incubation periods. a) Barru mesocosm experiment, b)
Takalar mesocosm experiment and c) Barrang Lompo Island mesocosm experiment.