Basic HTML Version


International Journal of Marine Science 2014, Vol.4, No.17: 160-165
http://ijms.sophiapublisher.com
163
varied very broadly from 0.04 to 0.50 d
-1
. At the
brackish-water stations 33 and 34 the pertinent values
were 0.13 and 0.53 d
-1
, correspondingly.
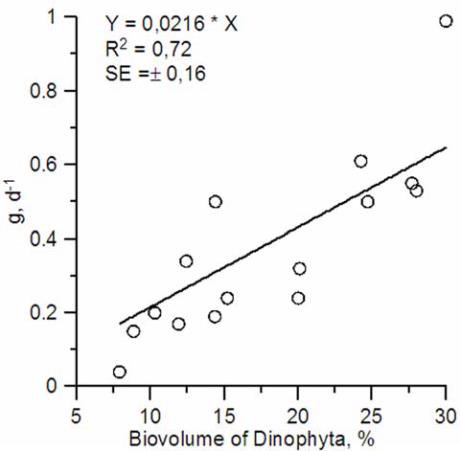
In the zone of
E. huxleyi
bloom the rate of
microzooplankton grazing on the phytoplankton (g)
reliably correlated with the relative percentage of
dinoflagellates in the total phytoplankton biovolume
(Figure 2). Regression analysis has shown that given
p = 0.00007, Fisher criterion for regression line was
33.1, i.e. several times greater than critical value. The
standard error of regression equation quotient was
estimated 15 % and Student criterion – several times
as large as critical. The minimums and maximums of
the phytoplankton loss due to microzooplankton
grazing concurred with the minimal and maximal
share of dinoflagellates in the total phytoplankton
biovolume. The dinoflagellates were represented
mainly by small forms (< 15 – 20 µm). According to
the regression equation, in the absence of
dinoflagellates the specific rate of microzooplankton
grazing declines to zero.
Figure 2 Relationship between specific biovolume of
Dinophyta and microzooplankton grazing of the phytoplankton
in the area of
E. huxleyi
bloom
In May 2013,
net growth rate of phytoplankton (µ – g)
in the sea surface was estimated -0.27 – 1.18 d
-1
(Table
2). Greatest values (0.56 – 1.18 d
-1
; average = 0.93 d
-1
)
were registered off the eastern coast of the Crimea.
According to the percent ratio g/µ, the loss of
phytoplankton production due to microzooplankton
grazing was as moderate as 19 % on the average.
Along the shallow-water band in the western Black Sea
the net growth rate was usually as large as 0.65-1.0 d
-1
;
the only exception was station 28 at which it was very
low (0.04 d
-1
) and the primary production consumed
by microzooplankton amounted to 96%. In the
samples taken at station 34 diatoms prevailed by both
numbers and biovolume, therefore the high net growth
rate of the phytoplankton (0.84 d
-1
) there. However, at
station 33 the total phytoplankton biovolume was also
largely owing to diatoms, the net growth rate was
below zero (– 0.27 d
-1
) and the daily loss of
phytoplankton due to microzooplankton grazing was
twice as large as the primary production (g/ µ = 200 %).
High net growth rates ranging 0.44 – 0.84 d
-1
(average
= 0.56 d
-1
) were registered in the phytoplankton of the
deep-water part of the western Black Sea. The primary
production consumed by microzooplankton (g/ µ)
fluctuated between 18 – 72 %, 51% on the average.
3 Discussions
It is known that phytoplankton bloom is generated by
concurrent favourable environmental factors such as
light, seawater temperature and the availability of
nutrients. However, phytoplankton abundance and
biomass are rapidly increasing to bloom values only
when specific growth rate of the phytoplankton is far
greater than the rate of microzooplankton grazing.
Some recent investigations point out that in the Black
Sea
E. huxleyi
most frequently increases its abundance
to bloom in summer, namely in June – July (Oguz and
Merico, 2006, Pautova et al., 2007). During these
months light intensity enhances to near-maximum
(40 – 50 E/m
2
·d) and the upper quasi-homogeneous
(mixed) layer (UML) warms up to 20
℃
and above.
Noteworthily, studies on
E. huxleyi
culture have
shown that culture-specific temperature optimum for
this coccolithophore is exactly 20
℃
, and high light
intensities do not inhibit microalgal photosynthesis
and growth (
Tyrrell and Merico,
2004
). Therefore the
assumption that the high light and warm sea can be the
drivers of summer
E. huxleyi
blooms. However, in the
Black Sea
E. huxleyi
blooms are not necessarily a
response to high light intensity and warm sea water. In
2010, the western part of the sea was blooming in
October when, compared to summer estimates, the
intensity of light has decreased 2 – 3 times to 25
E/m
2
·d, and the UML has cooled to 15-17
℃