Basic HTML Version


International Journal of Marine Science 2014, Vol.4, No.12: 108-118
http://ijms.sophiapublisher.com
109
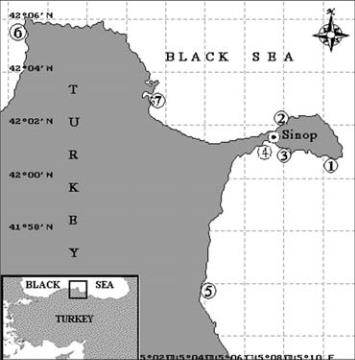
Figure 1 Map of the study area showing the sampling stations
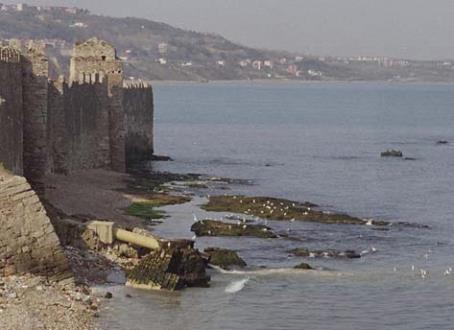
Figure 2 Sampling station 2 in Dis Liman of Sinop Peninsula
and domestic discharge point
Table 1 General description of coastal sediment sampling sites
Site/Station no.
Coordinates
Sampling Depth
Sampling Materials
Station Properties
1
42°00'57,00"N
35°11'05,96"E
0.5-1 m
Hand Dredge
Clean/ control station
2
42°01'50,54"N
35°09'03,03"E
0.5-1 m.
Hand Dredge
Untreated domestic
discharge
3
42°01'24,46"N
35°09'03,03"E
0.5-1 m.
Hand Dredge
Untreated domestic
discharge
4
42°01'24,46"N
35°09'01,34"E
0.5-1 m.
Hand Dredge
Shipyard of the city /
loading of petroleum
5
41°55'28,81"N
35°05'20,41"E
0.5-1 m.
Hand Dredge
Old Industrial discharge
area
6
42°05'46,24"N
34°56'40,56"E
0.5-1 m.
Hand Dredge
Clean/ control station
7
42°03'03,47"N
35°02'35,76"E
0.5- 1m.
Hand Dredge
Clean/ control station
2.1 Sediment sampling
Surface sediment samples were collected at 7 sites
monthly in 2006–2007. At each site, three surface
sediment (0-5 cm) samples were collected by scraping
the surface layer by using a hand dredge sampler. The
sediment samples were kept in separately labeled
pre-cleaned polyethylene bags and kept in an ice box.
As soon as the field work was finished, the samples
were transferred into the laboratory and preserved at
-21
℃
for future analysis. The samples of 15–20 g for
water content assessment were dried by using an
air-circulating oven at 105
℃
for 48 h. Concentration
of organic carbon (TOC) was measured in surface
sediment by drying the samples at 600
℃
for 4h.
Samples free of organic matter were also treated by
using diluted HCl to remove calcium carbonates and
the loss in weight was again determined, according to
the method described by Buchanan (1984).
In sediment samples, the porosity values are
calculated with water density and sediment density.
Redox potential (Eh) was also measured using an
electrode which was pushed stepwise down into an
undisturbed sediment core a 4 cm depth which provide
a better estimate of the sediment conditions (Pearson
and Stanley, 1979) and the readings were corrected for
hydrogen reference by adding +198 mv to the meter
reading (Pearson and Stanley, 1979). The electrode
was allowed to equilibrate for 2 min before each
reading (Jørgensen, 1977).
2.2 Water sampling
Water samples were taken from surface of the sea (less
than 1 m). Physico-chemical properties of wastewater
were determined according to the standards of the
American Public Health Association (APHA 2005).
Temperature, pH, TSS, salinity and dissolved oxygen
of surface water were determined at the collection