Basic HTML Version


International Journal of Marine Science 2013, Vol.3, No.9, 72-78
http://ijms.sophiapublisher.com
75
Figure 3
Average TOC in biomass per tree (in histograms) and percentage potentially sequestered carbon per tree (line graph) of
stem diameter classes used in the present study for
B. gymnorrhiza
and
L. racemosa
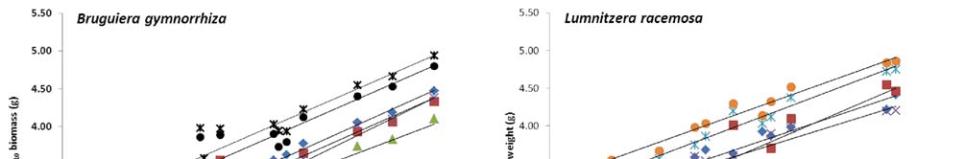
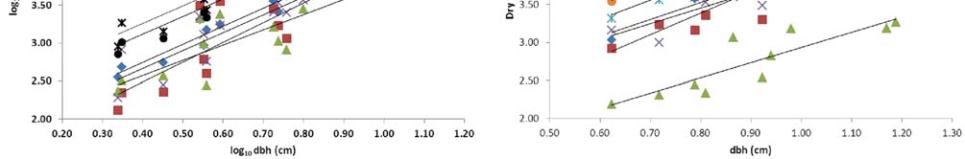
Figure 4 Relationship between dbh and organic carbon content in plant components and TOC of
B. gymnorrhiza
and
L. racemosa
.
Table 2 Allometric equations derived for estimating TOC (log
10
) content of separate plant components and total plant of
B.
gymnorrhiza
and
L. racemosa
Plant components
B. gymnorrhiza
r
2
Std
error
L. racemosa
r
2
Std
error
Stem
1.794 + 2.386 log
10
(dbh)
0.971
0.233
1.734 + 2.244 log
10
(dbh)
0.946
0.237
Leaves
1.766 + 2.014 log
10
(dbh)
0.780
0.611
0.921 + 2.011 log
10
(dbh)
0.761
0.497
Root
1.718 + 2.364 log
10
(dbh)
0.882
0.496
1.805 + 2.063 log
10
(dbh)
0.855
0.376
Above-ground
fraction
2.183 + 2.332 log
10
(dbh)
0.907
0.427
1.788 + 2.529 log
10
(dbh)
0.960
0.227
Total tree/plant
2.329 + 2.323 log
10
(dbh)
0.911
0.415
2.073 + 2.381 log
10
(dbh)
0.958
0.219
Note: * r
2
is the coefficient of determination and Std
error
is the stranded error of estimate