Basic HTML Version


International Journal of Marine Science 2013, Vol.3, No.41, 333-343
http://ijms.sophiapublisher.com
341
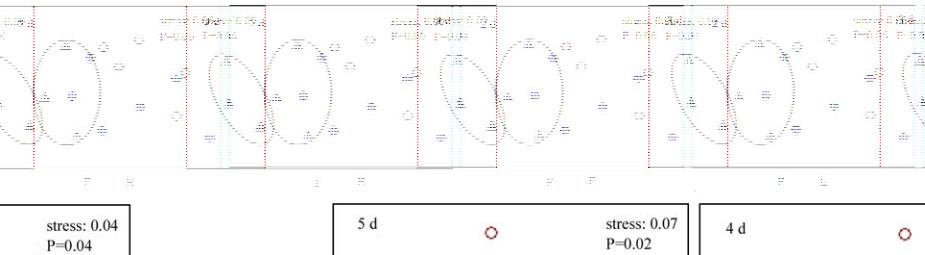
that the points for each treatment formed relatively
tight groups that were discrete from each other. This
corresponds to the period when the growth response
of cyanophytes was most apparent (Figure 5b).
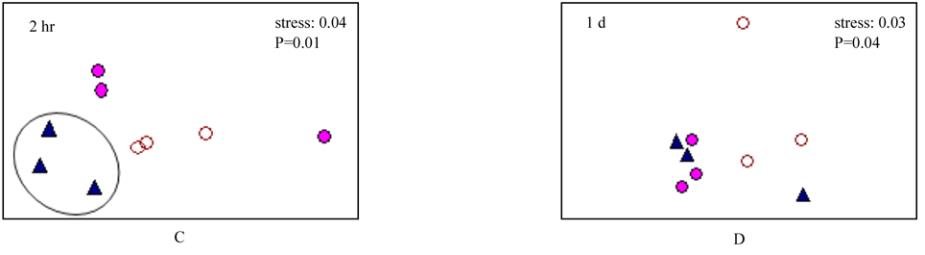
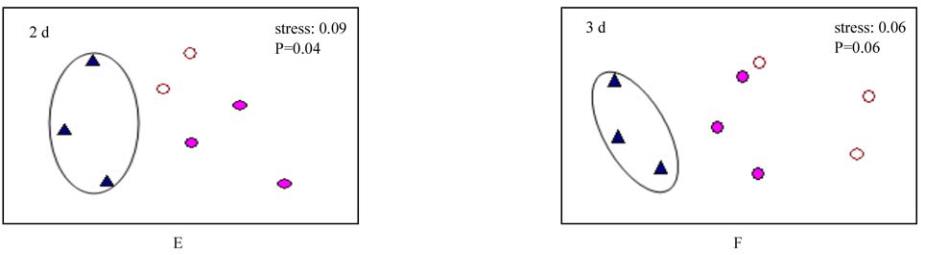
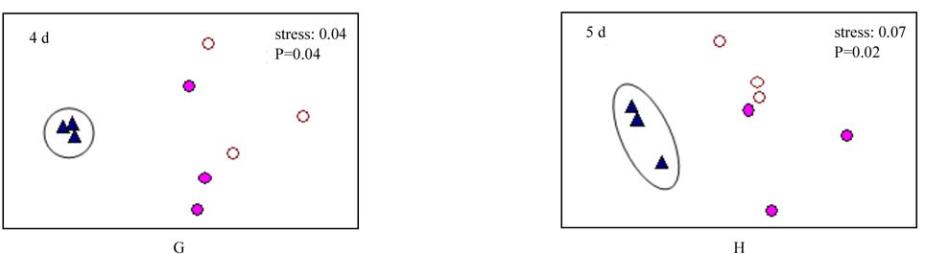
Figure 5 nMDS ordination plots of phytoplankton assemblages for the three treatments at each time sampled: A: before disturbance,
B: 30 minutes after disturbance, C: 3 hours after disturbance, D: 1 day, E: 2 days, F: 3 days, G: 4 days and H: 5 days after disturbance
A one-way ANOSIM indicated an overall difference
between treatments when all times were pooled
(Global R = 0.414, P = 0.001). Due to the limited the
number of samples representing each treatment at
each sampling time (N=3), it was not possible to
detect significant differences using pairwise ANOSIM
tests (Table 4). Thus, the magnitude of the R-statistic
value is used as a guideline for ascertaining the extent
of the differences between treatments at the different
times. In this case, Global R values exceeding 0.8 are
considered to represent a strong difference between
pairs (30 min, 3 hr, 4 days and 5 days) and Global R