Basic HTML Version


International Journal of Marine Science 2013, Vol.3, No.41, 333-343
http://ijms.sophiapublisher.com
338
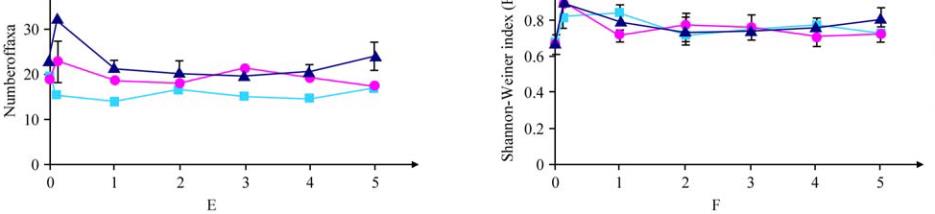
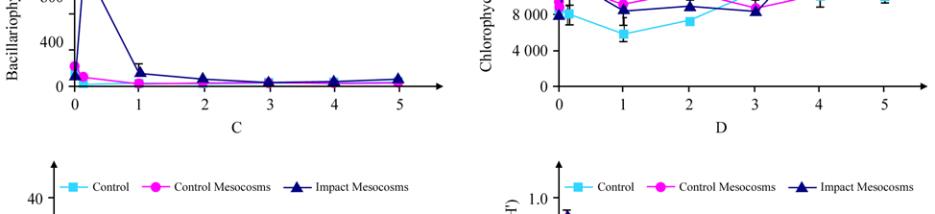
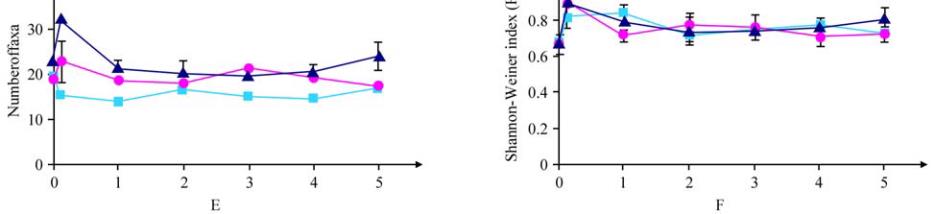
Figure 4 Abundance of A: all cells, B: Cyanophyceae, C: Bacillariophyceae and D: Chlorophyceae, and E: number of taxa observed
and F: Shannon-Wiener Index (H’) (mean ±SE, n=3). In some cases, the error bars are too small to be visible
diatoms was reduced to <200 cells/mL and dropped
further to pre-mixing densities for the remainder of the
experiment. The abundance of Bacillariophyceae
differed significantly between mesocosm treatments
but only for a short period following disturbance (30
min and 1 day), with IMs exhibiting greater diatom
abundance than the control treatments.
There was little apparent difference in abundance of
Chlorophyceae between control and impact mesocosms
up to Day 4, when Chlorophyceae cell numbers
increased by a factor of 2 in the IMs. The dominant
taxa of Chlorophyceae in the IMs 4 days following
sediment disturbance was
Gloeocystis,
which contributed
18% of total cell abundance. The result of one-way
ANOVAs showed that abundance of Chlorophyceae
was significantly different at 30 min, 4 and 5 days
after sediment disturbance, with IMs having a greater
abundance of Chlorophyceae than control treatments
at Day 4 (Table 2). Chlorophyceae in CMs also
showed a significant increase in abundance, but not
until Day 5 (Figure 4 d).
There were 110 microalgal taxa identified in the
120 samples collected during the mesocosm study.
Of these, Chlorophyceae and Bacillariophyceae
were represented by 55 and 35 taxa, respectively.
The remaining taxa fell with the following Classes: