Basic HTML Version


International Journal of Marine Science 2013, Vol.3, No.41, 333-343
http://ijms.sophiapublisher.com
336
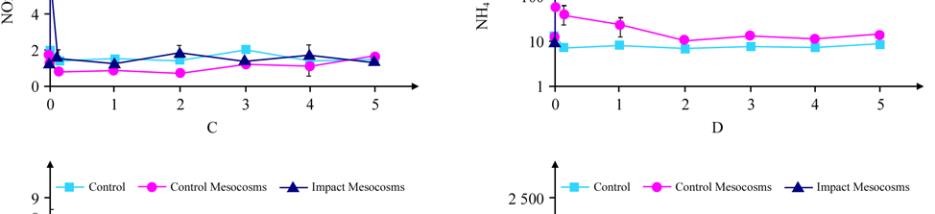
Figure 3 Turbidity, pH, NO
X
, NH
4
, PO
4
and SiO
2
concentrations (mean
±
SE; n
= 3) for the three treatments prior to and following
mesocosm installation and sediment disturbance. In many cases, the SE bars are very small and thus not visible
disturbance, with pH values in CMs being higher than
in control sites and IMs (Table 1).
Nitrate plus nitrite (NO
x
) concentrations were low and <
2
μ
g/L for all samples except for a slight increase
immediately following gyttja disturbance in the IMs
(Figure 3c). Despite this short-lived effect, there was
no significant difference in NO
x
levels among
treatments, during the entire experiment (Table 1).
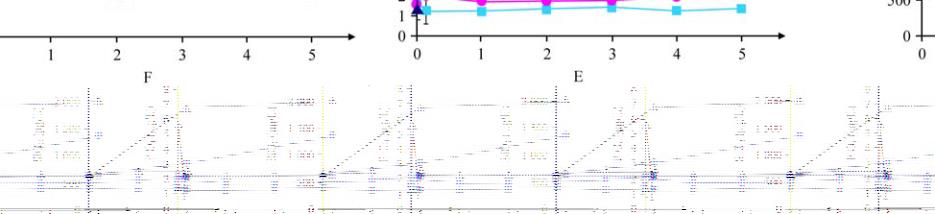
Water column concentrations of NH
4
+
at control sites
were low and < 20
μ
g/L prior to and following the
deployment of the mesocosms (Figure 4d). While
CMs experienced a minor increase in NH
4
+
(about 50
μ
g/L) following deployment, IMs showed a very large
injection of NH
4
+
(
≈
2000
μ
g/L) into the water column,
with levels remaining above 1000
μ
g/L for the
duration of the experiment. ANOVA detected a
significant difference with treatment; LSD post hoc
tests showed that concentrations of NH
4
+
in IMs were
always significantly greater than in the other two
treatments (Table 1).
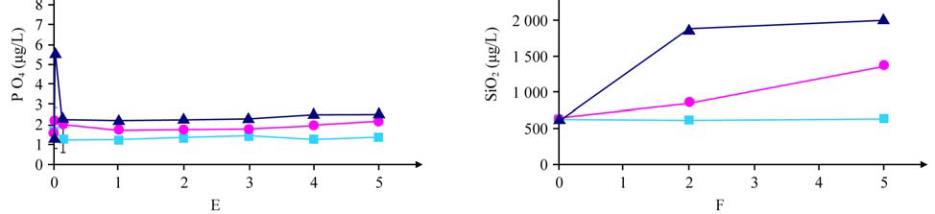
Mean concentrations of PO
4
were low (1-6 µg/L) and
near detection levels (1 µg/L) throughout the
experiment (Figure 3e). PO
4
mirrored trends in NO
x
levels, which increased slightly in the IMs upon
sediment disturbance. Although levels were low,
ANOVAs indicated significant differences between