Basic HTML Version


International Journal of Marine Science 2013, Vol.3, No.24, 187-192
http://ijms.sophiapublisher.com
189
So far, no stock assessment for skipjack tuna in the
Indian Ocean and MSY has been estimated. Stock
should be closely monitored. Evidence from
retrospective records strongly suggests that major
structural and functional changes due to overfishing of
tunas occurred in Indian Ocean in recent years. Severe
overfishing derives species ecological extinction
because overfished populations no longer interact
significantly with other species in the community
(Jackson et al., 2001). Periodic reassessment of the
tuna potential is also required with adequate inputs
from exploratory surveys as well as commercial
landings and this may prevent any unsustainable trends
in the development of the tuna fishing industry in the
Indian Ocean.
3.3 Tuna production of EEZ of India
Annual marine fish production in India during 2010
was 3.07 (mt) against a catchable potential of 3.93 (mt)
(CMFRI, 2011). The Indian tuna fishery comprises two
distinct segments, the coastal fishery and oceanic
fishery. The oceanic fishery uses exclusively longlines,
targeting large deep-swimming yellowfin and bigeye
tunas. Tuna constitutes one of the important marine
fisheries resources of India having an estimated annual
catchable potential of about 2.78 lakh t in the EEZ.
Coastal resources almost fully exploited and current
focus is on oceanic/deep sea resources. India is yet to
find a place in the tuna map of the Indian Ocean. The
fishery resource of estimated potential tuna and tuna
like species is 2,50,000 t; however, current production
is around 65,863 t, most of which constituted by coastal
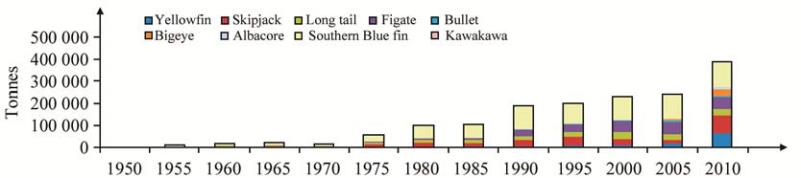
tuna species. Figure 3 illustrates all Indian tuna
production which has continued to increase with
fluctuations from 63,633 t during 2001-2005, 78,400 t
during 2006-2010, and 65,863 t in 2010. However,
during the last couple of year’s landings in drift gillnet,
hook and line and troll lines operated by small and
medium sized mechanized vessels are reported to have
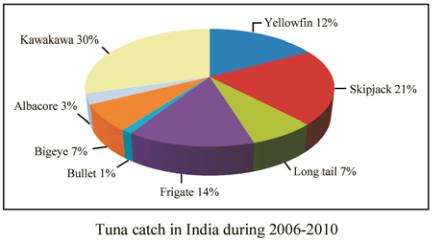
increased marginally (IOTC, 2011). Of the total tuna
landings oceanic species formed 47% and neritic
species 53%. Among the oceanic species skipjack
constituted 21% followed by yellowfin 12%, bigeye
7%, and albacore 3% (Figure 4). Among the neritic
tunas, kawakawa (
Euthynnus affinis
) was dominant
(30%) followed by frigate tuna (14%), longtail tuna
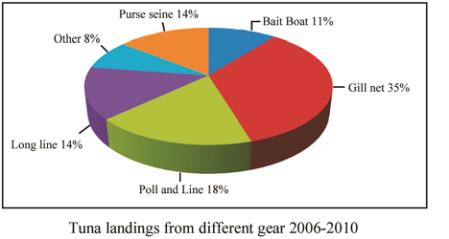
(7%) among others. In the tuna landings from the
Indian coast, gillnets accounted for about 35% of the
catch, pole and line 29%, long line 14 %, purse seine
14%, and the remaining by a variety of other gears 8%
(Figure 5). The present annual export of tuna and tuna
products amounts to 35,000 t valued at $53.22 million
dollar, the major importing countries were Southeast
Figure 3 Trends in tuna catch in Indian EEZ from 1950-2010
Figure 4 Species-wise contribution of tuna catch in Indian EEZ
from 2006-2010
Figure 5 Gear-wise contribution of tuna in Indian EEZ from
2006-2010