Basic HTML Version


International Journal of Marine Science 2013, Vol.3, No.14, 111-120
http://ijms.sophiapublisher.com
118
inland resulting in the characteristic environmental
and biological gradients associated with the lagoon
(Uwadiae, 2009).
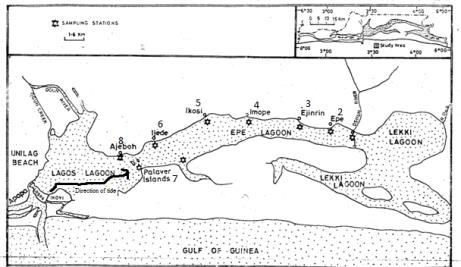
Figure 6 Part of Lagos Lagoon system showing Epe Lagoon
and study stations
The local climate is tropical, with two major seasons
differentiated by the amount of rainfall as rainy and
dry seasons. The rainy season experiences higher
amount of rainfall and extends from April/May to
November, while the dry season which depicts a
period of relatively lower amount of rain begins in
December and ends in March. Epe Lagoon is
sandwich between two lagoons Lekki and Lagos
Lagoons (Figure 6) and is surrounded by rural areas
with poor and unorganized waste management
systems.
Human impacts on the lagoon and the surrounding
environment include dumping of untreated domestic
wastes, fishing, sand mining, transportation of people
and goods using motorized boats and the
transportation of logs of timber in the water. A
Thermal Electric Power station is located in the study
stretch where this study was carried out precisely at
station six. A major feature of the lagoon is the
overwhelming preponderance of water hyacinth which
has been linked to the degradation of the lagoon
ecosystem (Nwankwo, 1998).
3.2 Data collection and laboratory analyses
Eight study stations were chosen based on
accessibility; stations were distributed throughout the
length of the lagoon. Twenty-four monthly samples
were taken during two consecutive years from 2004 to
2006. Water temperature was measured with a
graduated thermometer while salinity and dissolved
oxygen were evaluated by the chlorinity and Winkler
methods respectively (APHA, 1998).
From each station, samples of benthic macrofauna
were taken in three replicates with a van Veen grab
having a surface area of 0.1 m
2
. Samples were washed
through a sieve of 0.5 mm mesh size and organisms
retained by the sieved were preserved with 10%
formaldehyde solution
in situ
. The upper portion of
the third replicate of the grab samples for each station
were carefully taken and placed in labeled
polyethylene bags for sediment analyses in the
laboratory. The samples were stored in the refrigerator
prior to analysis. In the laboratory preserved benthic
samples were washed with tap water to remove the
preservative and any remaining sediment for easy
sorting. The molluscs animals were sorted into
different
taxonomic
groups
using
suitable
identification manuals including Buchanan (1954),
Edmunds (1978), Barnes (1987), Yankson and
Kendall (2001). The numbers of taxa and individuals
for each station were counted and recorded for all the
sampling months. Molluscs were counted and their
density calculated for each study station throughout
the two-year period of study.
For the sediment samples 100 g fresh weight was
collected to determine the total organic matter content
(TOC) in the sediment. The latter was calculated from
the weight loss after ignition at 500
℃
for 4 hours,
after previously drying for 48 hours at 60
℃
(APHA,
1998). Sediment was categorized by major fraction
(mud/sand), based on procedures outlined in APHA
(1998).
3.3 Statistical analysis
One-Way analysis of variance (ANOVA) was used to
determine variations in environmental conditions at
the study stations. When significant variations are
detected, a
post hoc test
using Duncan New Multiple
Range Test (DMRT) in the case of physico-chemical
variables and Turkey’s Test in the case of biotic
variables were performed to determine the locations of
significant differences.
The following ecological parameters were assessed to
describe the structure and composition of molluscs;
density = number of individuals per 0.1 m
2
(ind./m
2
),
mean spatial density of species = total density of
species/number of study stations, % representation =
percentage contribution of species, taxa richness (S) =
total number of taxa per station); taxonomic diversity