International Journal of Marine Science, 2017, Vol.7, No.26, 260-271
264
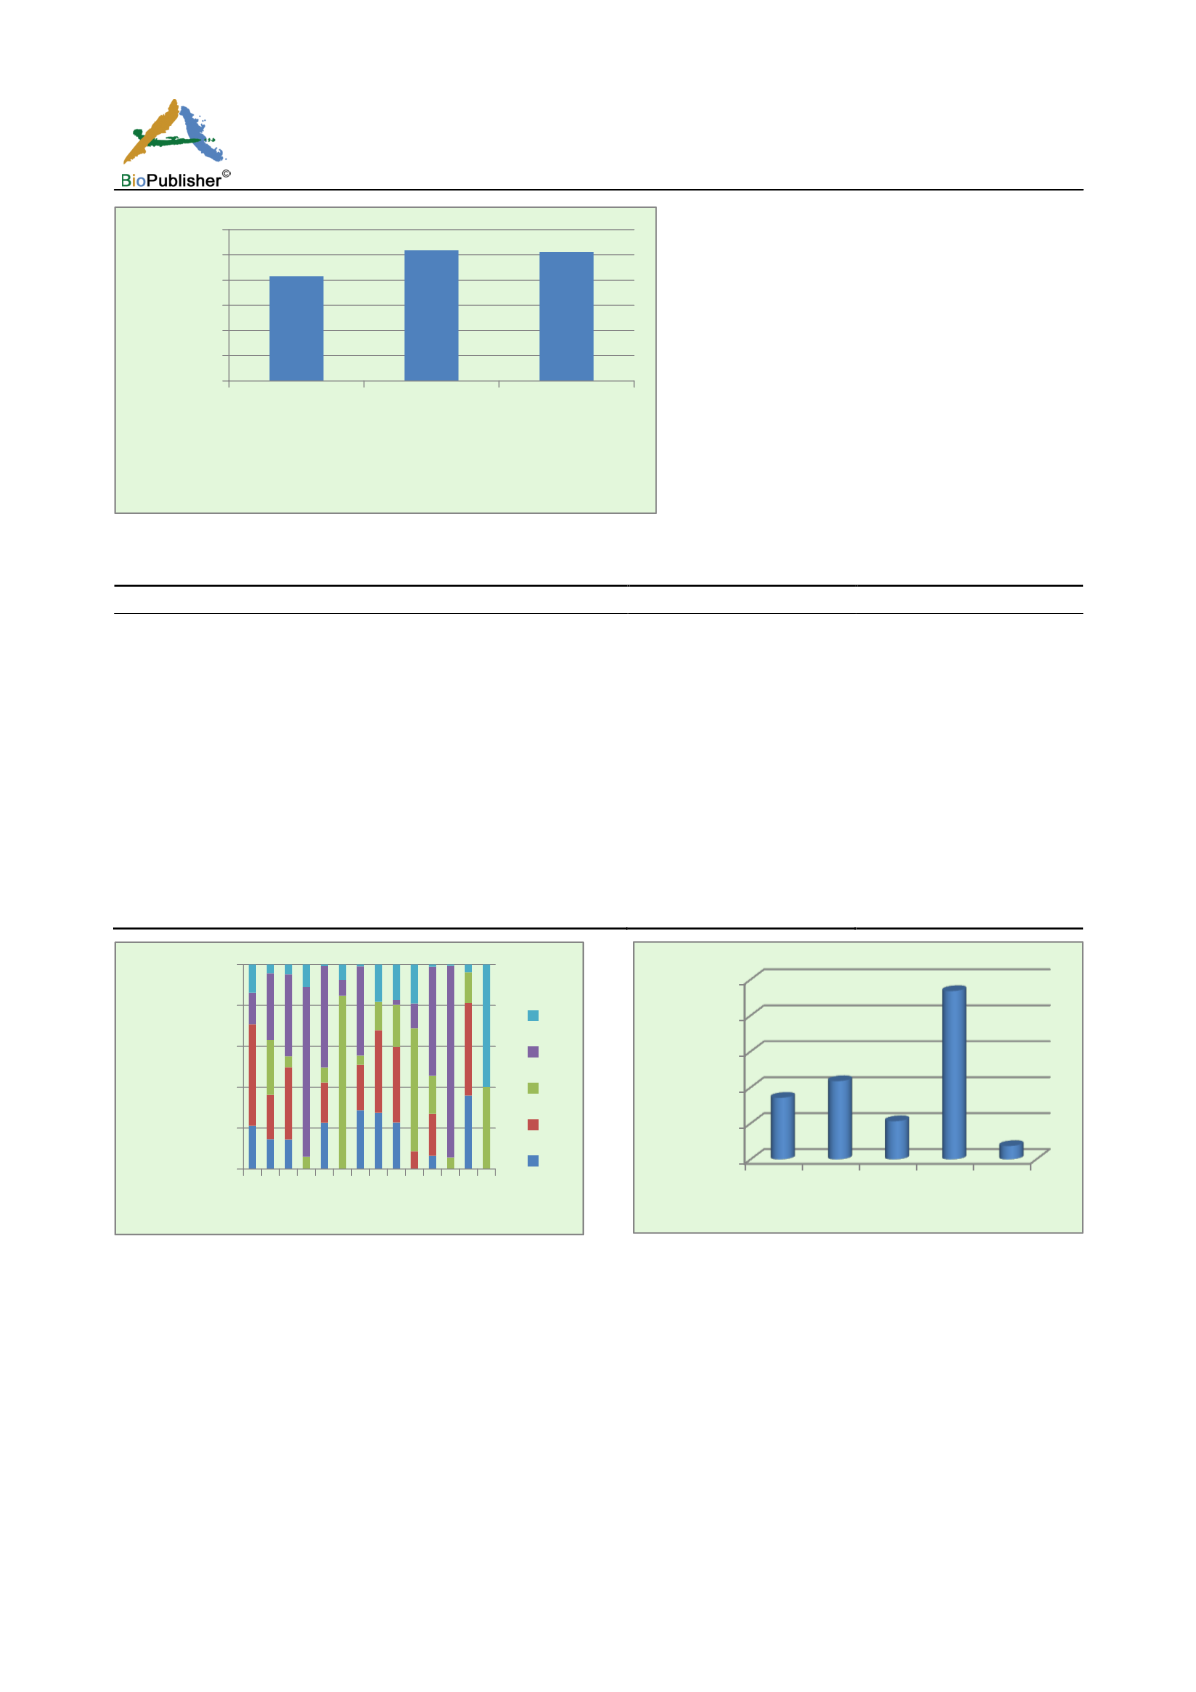
Figure 2 Mean mercury content in the sediments of different zones
Table 3 Comparison of THg content in Kongsfjorden with different regions of Arctic
THg (ng/g dry wt.)
Site
Reference
485 (14-185)
Kongsfjorden, NyAlesund
Present study
2-250
Greenland
Lindeberg et al., 2006
10 - 159
Canada
Lockhart et al.,
20-100
Sweden
Rydberg et al.,
8
Arctic
Muir et al.,
13
Sub-Arctic
Muir et al.,
21-48
NyAlesund
Jiang et al., 2011
9 - 86
Kongsfjorden, NyAlesund
Liu et al., 2015
22
Kongsfjorden, NyAlesund
Lu et al., 2012
6
Alaska
AMAP, 2002
2
East Siberia Sea
Presley, 1997
28
Kara Sea
Esnough, 1996
Figure 3 The percentage of mercury in various fractions of
Kongsfjorden sediments
Figure 4 Mean percentage of mercury in fractions
The percentage of elemental mercury was high when compared with other fractions. The high content of
elemental form of mercury has indicated that the sediment was contaminated (Lechler et al., 1997; Pestana et al.,
2000; Ramsamy et al., 2012). This form of mercury is highly persistent and it remains available for chemical and
biological transformations to highly toxic organic forms (Biester et al., 2002; Wang et al., 2004).
The fraction-1 and 2 are easily available as these fractions are weakly bound to sediments. The former one is
bound to dissolved organic matter without a Hg-C bond or suspended matter in pore waters whereas the later one
is bound to iron monosulfides, iron and manganese hydroxides and carbonates (Biester and Scholz, 1997;
Wallaschlager et al., 1998; Renneberg and Dudas, 2001; Kot, 2004). Even though the F1 is water soluble form, it
may not be in form of water soluble ionic species. The F2 is easily susceptible to pH variations and changes in
0
100
200
300
400
500
600
Outer
Middle Transitional and
inner
THg (ng/g)
Zone
0%
20%
40%
60%
80%
100%
1 3 5 7 9 11 13
Hg
F5
F4
F3
F2
F1
0
10
20
30
40
50
F1 F2 F3 F4 F5
%


