International Journal of Horticulture 2015, Vol.5, No.4, 1
-
11
3
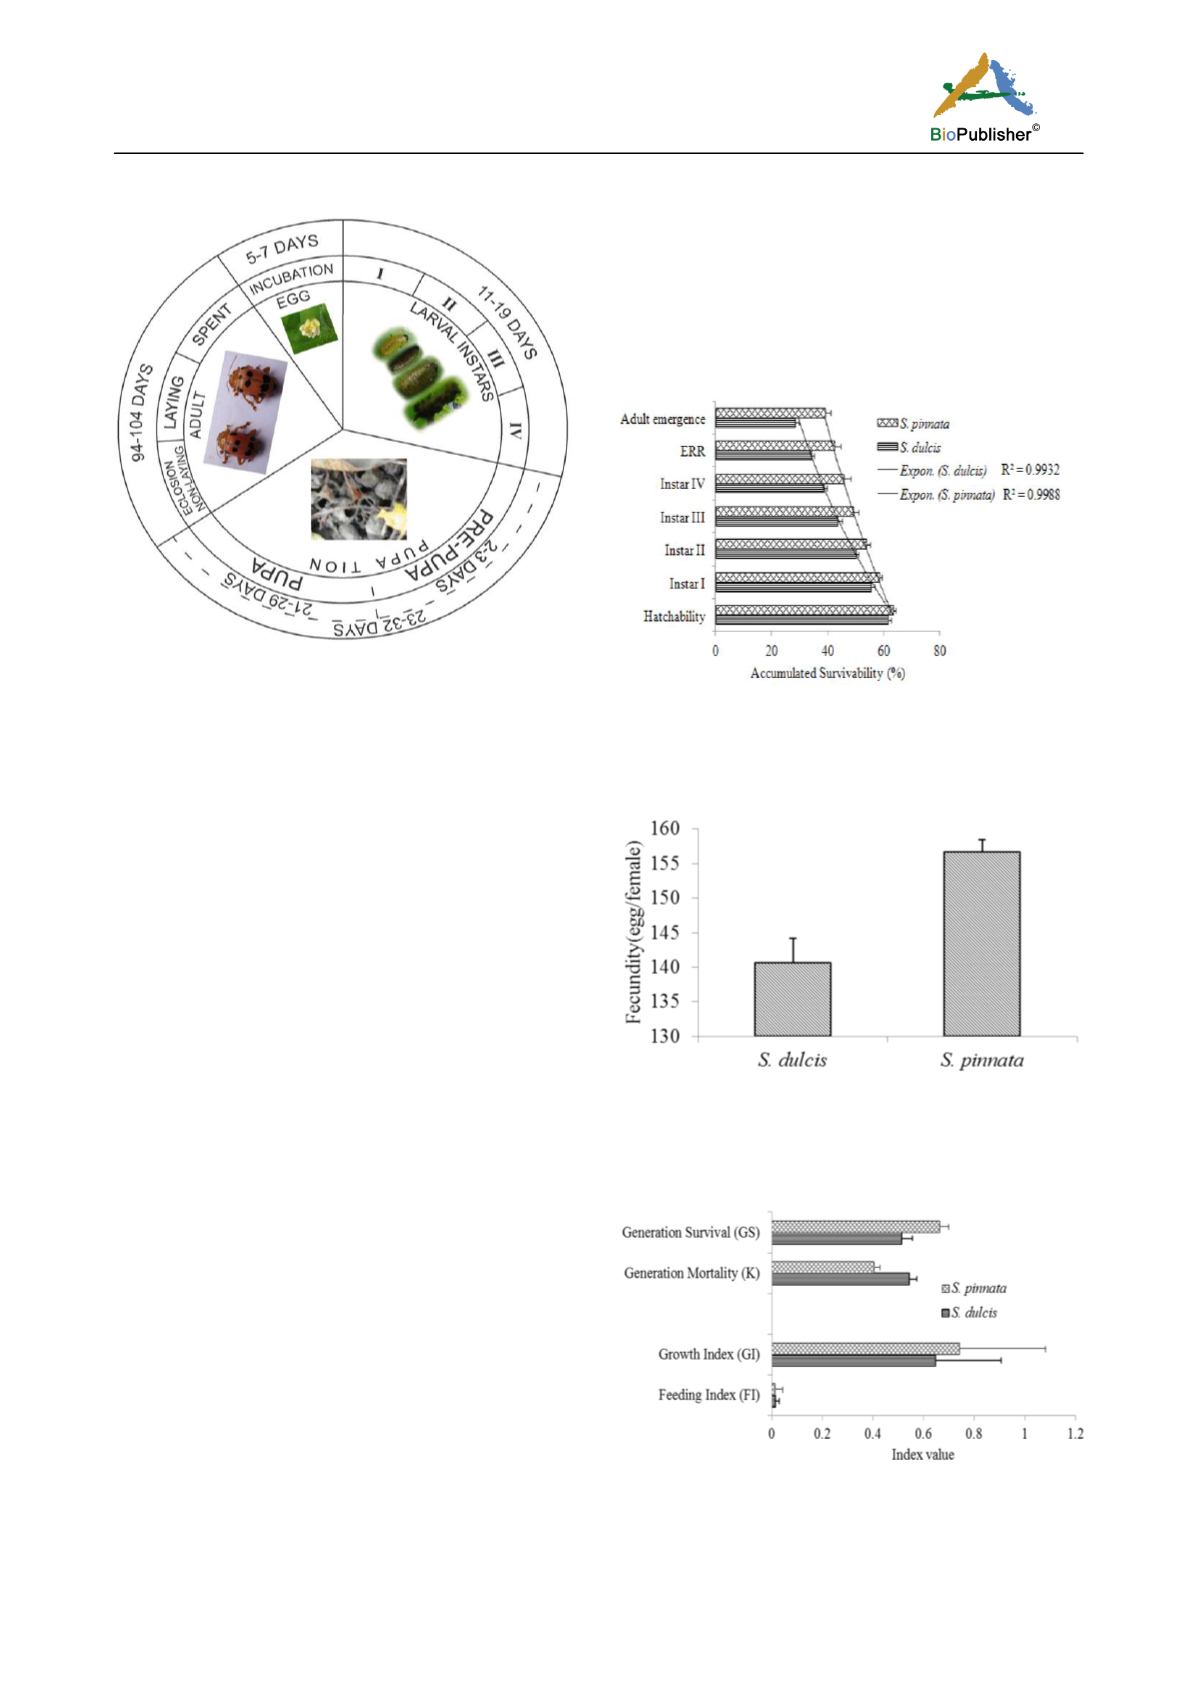
Figure 1 Schematic representation of the life cycle of
Podontia
quatuordecimpunctata
L.
The developmental duration (i.e., larval and post
larval duration) of the different stages of
P.
quatuordecimpunctata
on
S. pinnata
was shorter than
S. dulcis
but the adult longevity was always longer on
S. pinnata
. Food utilization efficiency measures of the
all four instars and their adults of
P.
quatuordecimpunctata
are given in Tables 2-6. They
displayed higher value of food utilization indices (GR,
CR, RGR, CI, ER, HCR, AD, ECI, ECD and HUE)
when reared on
S. pinnata
leaves compare to
S. dulcis
as their host plant and showed different pattern of
significance throughout all the feeding stages (Tables
2~6). The first instar larvae have no significant
difference in all feeding indices except CR (Table 2),
whereas, adults have highly significant differences for
all feeding indices between the host plants (Table 6).
In second, third and fourth instars RGR, CI, HCR and
ECI values were significantly different (
P
<0.05)
instead, GR and CR for second instar (Table 3), ER
for second and third instar as well as AD and HUE for
third and fourth instar (Table 4 and 5) are also
significantly differed (
P
<0.05). The accumulated
survivability throughout the developmental stages
were greatest when the insects fed with
S. pinnata
leaves (R
2
=0.9988) instead of
S. dulcis
(R
2
=0.9932)
leaves and significantly differed (
P
<0.05) (Figure 2).
The adult emergence was significantly higher
(
F
1,4
=21.560,
P
< 0.01) on
S. pinnata
leaves
(39.12±1.91%) relative to
S. dulcis
leaves
(28.42±1.29%) (Figure 2). The fecundity was always
higher on
S. pinnata
leaves (156.67±1.76 eggs/female)
than
S. dulcis
(140.67±3.53 eggs/female) and
significantly differed (
F
2,4
=16.457,
P
< 0.01)(Figure 3).
The FI (
F
2,4
=18.451,
P
< 0.001) and GI (
F
2, 4
=24.643,
P
< 0.01) of
P. quatuordecimpunctata
was higher on
S.
pinnata
(0.015±0.027 and 0.741±0.340, respectively)
than
S. dulcis
(0.014±0.015 and 0.647±0.260,
respectively) (Figure 4).
Figure 2 Accumulated survivability (%) of
P.
quatuordecimpunctata
on
S. dulcis
and
S. pinnata
leaves. Mean ±
SE of 3 observations are significantly different (
P
< 0.05),
while comparing one type of host plant as food with the other
Figure 3 Fecundity of
P. quatuordecimpunctata
on
S. dulcis
and
S. pinnata
leaves. Mean ± SE of 3 observations are
significantly different (
P
< 0.05), while comparing one type of
host plant as food with the other
Figure 4 Feeding index (FI), Growth index (GI), Generation
mortality (K) and Generation survival (GS) of
P.
quatuordecimpunctata
on
S. dulcis
and
S. pinnata
leaves. Mean
± SE of 3 observations are significantly different (
P
< 0.05),
while comparing one type of host plant as food with the other


