International Journal of Horticulture, 2017,Vol.7, No. 23, 205-218
208
A three dimensional representation of proliferation rates drawn in R with the program `persp', taking independent
variables as seed weight and time, makes the comparison more transparent.
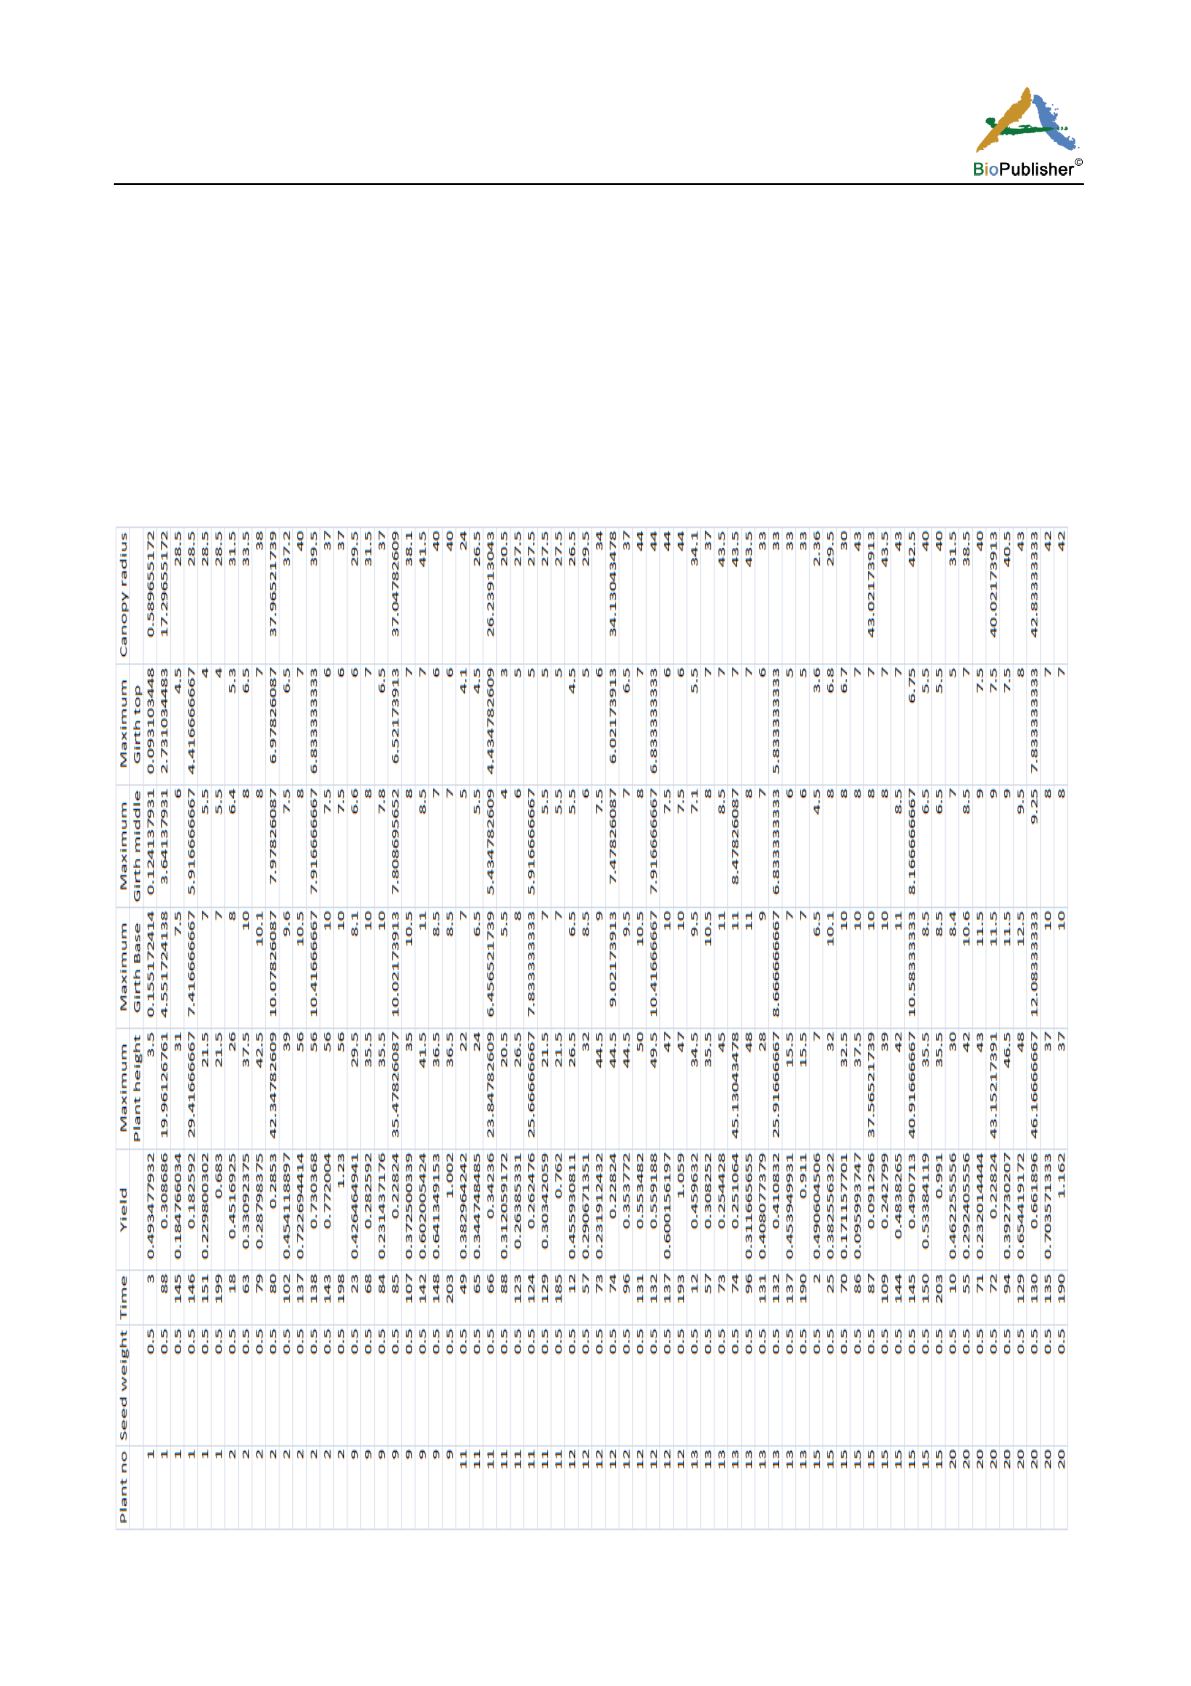
Figure 3, Figure 4, Figure 5, Figure 6,and Figure 7 show longitudinal growth characteristics of 31 plants at
different time points when growth data were collected; the growth values are linearly interpolated in the case
growth data is not available for a plant at a time point (measured from sprouting time of the plant), when another
plant in the experiment had growth data recorded at that time (measured from sprouting time of that plant).
Sprouting times are in general different for different plants. Three dimensional figures, except the one based on
seed weight, are computed on interpolated values given in Figure 3, Figure 4, Figure 5, Figure 6, and Figure 7.
Two dimensional figures are based on raw data collected on plants; not on interpolated values given in Figure 3,
Figure 4, Figure 5, Figure 6, and Figure 7.
Figure 3 500g seed weight plant characteristics under interpolation from observed data: time (day), yield (kg), other variables (cm)


