International Journal of Aquaculture, 2016, Vol.6, No.19, 1
-
10
6
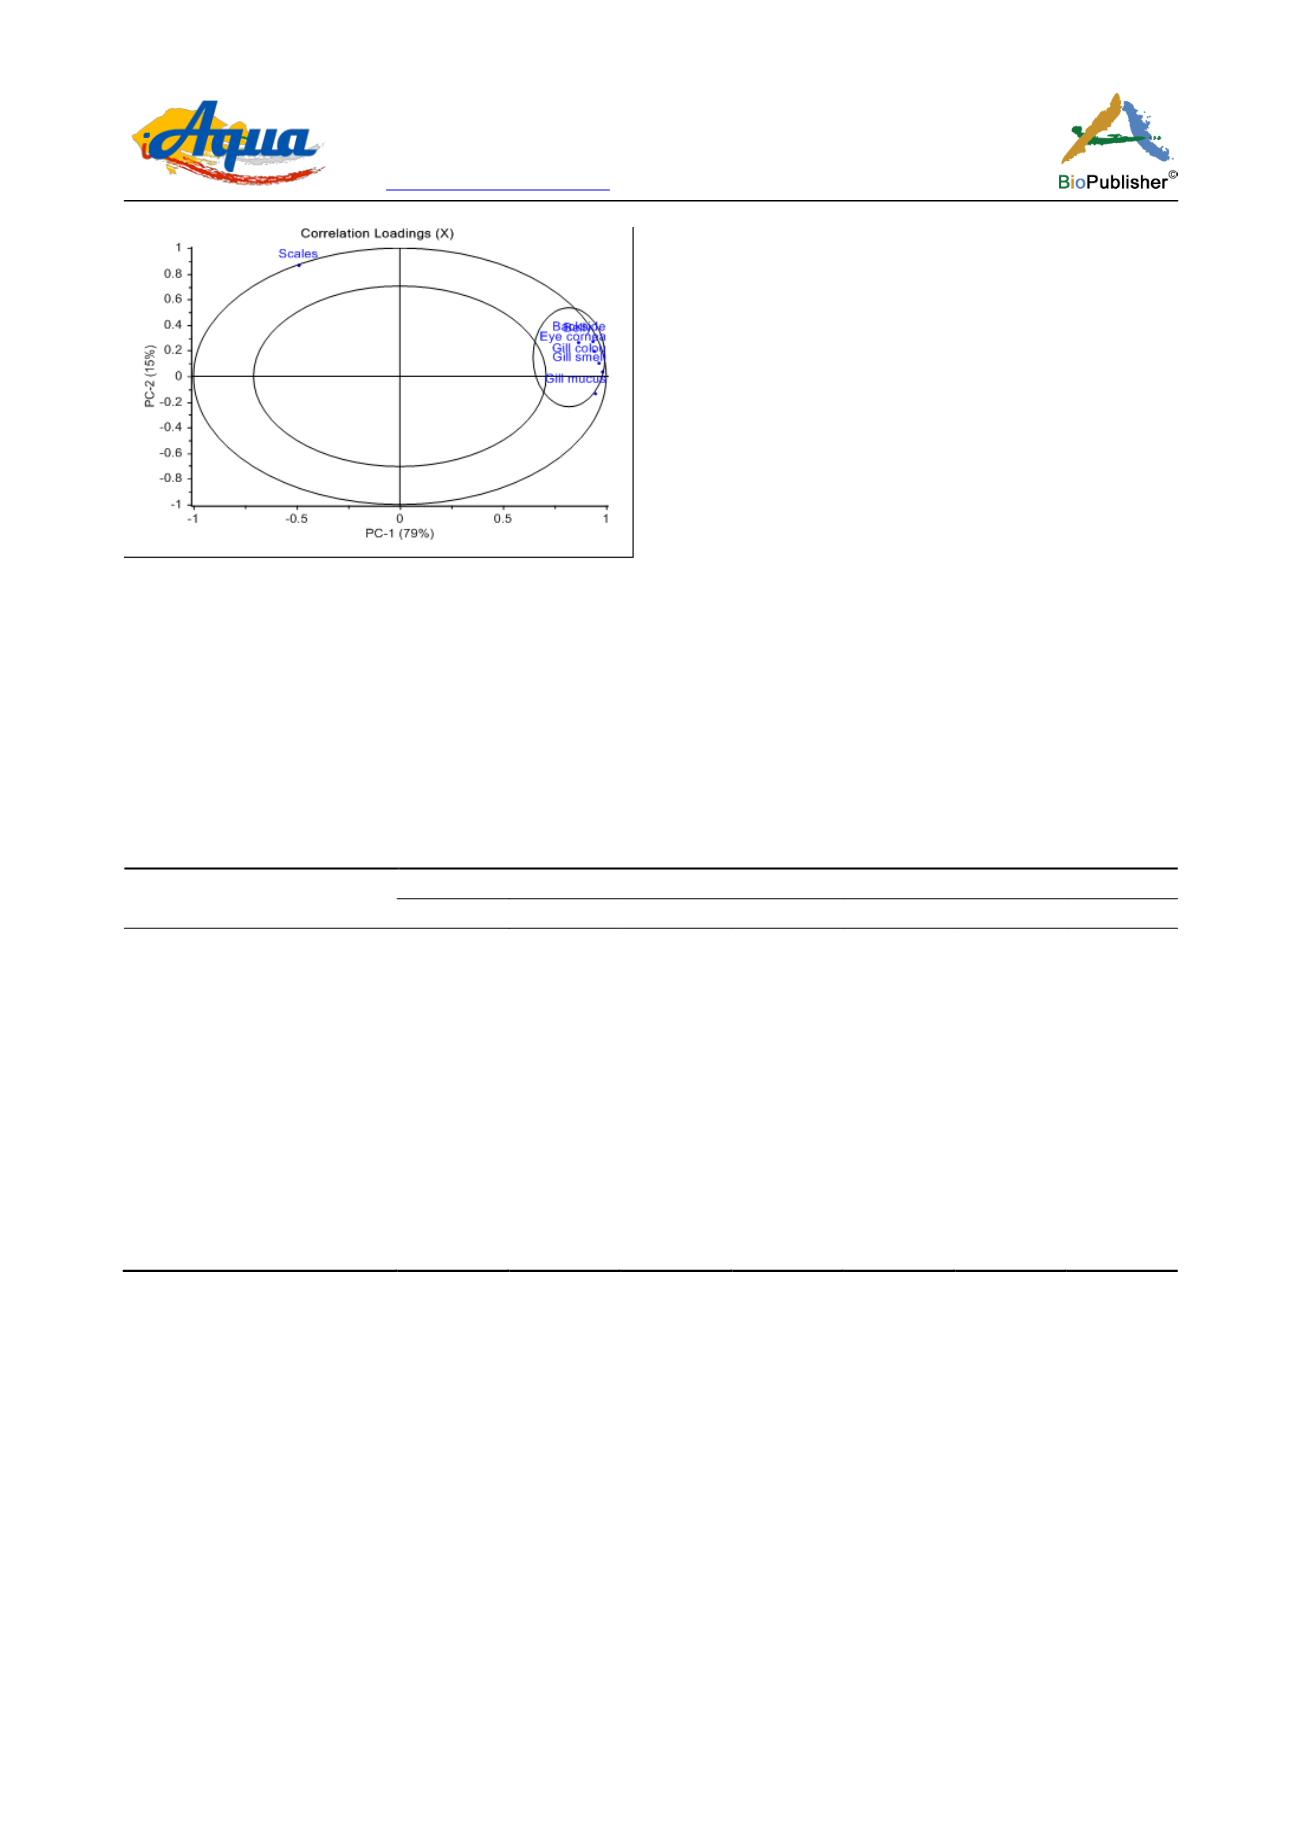
Figure 4 PCA correlation loadings of the various sensory parameters used for determining level of freshness and quality of Lake
Malawi Tilapia (
Chambo
) stored in ice for 21 days
3.2 Microbiological analysis
Highest number of bacteria was observed on day 15 and bacterial load at the time of sensory rejection was
1.6×10⁷ cfu/g, cfu/cm
2
(Table 2). Bacteria growth was slow at the beginning of storage but suddenly shot up after
12th day and stagnated after day 15 appearing to coincide with sensory quality scores. Highest quantities of
bacteria were observed in the gills (4.0×10⁵ cfu/g) on day 15 and intestines (9.6×10⁷ cfu/g) on day 21.
Table 2 Mean population densities (TVC) of bacteria isolated from whole fresh Lake Malawi Tilapia (
Chambo
) fish samples during
storage in ice for 21 days
Fish part
Days in ice
1
3
6
12
15
18
21
Skin surface (log cfu/cm
2
)
Stdev.
4.4×10
3
±2.2×10
2
8.6×10
3
±7.7×10
2
1.2×10
4
±1.0×10
3
1.7×10
4
±1.5×10
3
2.8×10
4
±3.3×10
3
3.9×10
4
±1.1×10
3
5.6×10
4
±3.0×10
3
Muscle (log cfu/g)
Stdev.
1.1×10
2
±2.6×10
1
3.8 ×10
3
±5.2×10
2
9.8 ×10
3
±3.0×10
2
2.7 ×10
4
±3.0×10
3
1.8 ×10
5
±2.1×10
5
2.5 ×10
5
±3.1×10
4
6.2 ×10
5
±4.4×10
4
Gills (log cfu/g)
Stdev.
1.2×10
5
±1.0×10
5
1.9×10
5
±1.1×10
4
2.1×10
5
±2.6×10
3
2.6×10
5
±3.610
3
4.0×10
5
±5.0×10
3
3.6×10
5
±5.4×10
4
2.5×10
5
±7.6×10
3
Kidney (log cfu/g)
Stdev.
9.1×10
3
±6.7×10
2
7.3×10
4
±9.2×10
4
1.9×10
4
±2.0×10
3
1.2×10
4
±1.7×10
3
7.2×10
3
±1.0×10
3
3.8×10
3
±2.4×10
3
2.5×10
4
±1.2×10
4
Intestines (log cfu/g)
Stdev.
4.0×10
3
±6.4×10
2
1.4×10
6
±1.2×10
5
1.7×10
6
±1.5×10
6
7.7×10
6
±8.5×10
5
8.0×10
7
±5.2×10
6
8.4×10
7
±1.1×10
7
9.6×10
7
±1.5×10
6
TVC (cfu/g, cfu/cm
2
)
Stdev.
2.9×10
4
±6.4×10
4
3.5×10
5
±5.8×10
5
3.9×10
5
±9.0×10
5
1.6×10
6
±3.1×10
6
1.6×10
7
±3.3×10
7
1.6×10
7
±3.4×10
7
1.9×10
7
±3.9×10
7
3.3 Biochemical analysis
TMA-N and TVB-N for freshly caught fish was 0.7 and 5.1 mg/100g, which increased to 3.4 and 26.4 mg/100g
respectively at the time of sensory rejection (Figure 5). TVB-N and TMA-N levels increased drastically after day
12 also coinciding with the significant increase in bacteria populations in the fish.
3.4 Physio-chemical analysis
Initial pH of the fish muscle at day 0 was close to neutral (6.47) but continued fluctuating around 6.40 before
reaching the lowest point of 5.84 at day 16 which consequently was sensory rejection time, then rose sharply up to
6.48 and 6.86 on day 18 and 20 respectively (Figure 6). In general, the muscle/flesh pH of the fresh Chambo fish
significantly decreased with storage time in ice after day 12 (P < 0.05).


