International Journal of Aquaculture, 2016, Vol.6, No.22, 1
-
11
5
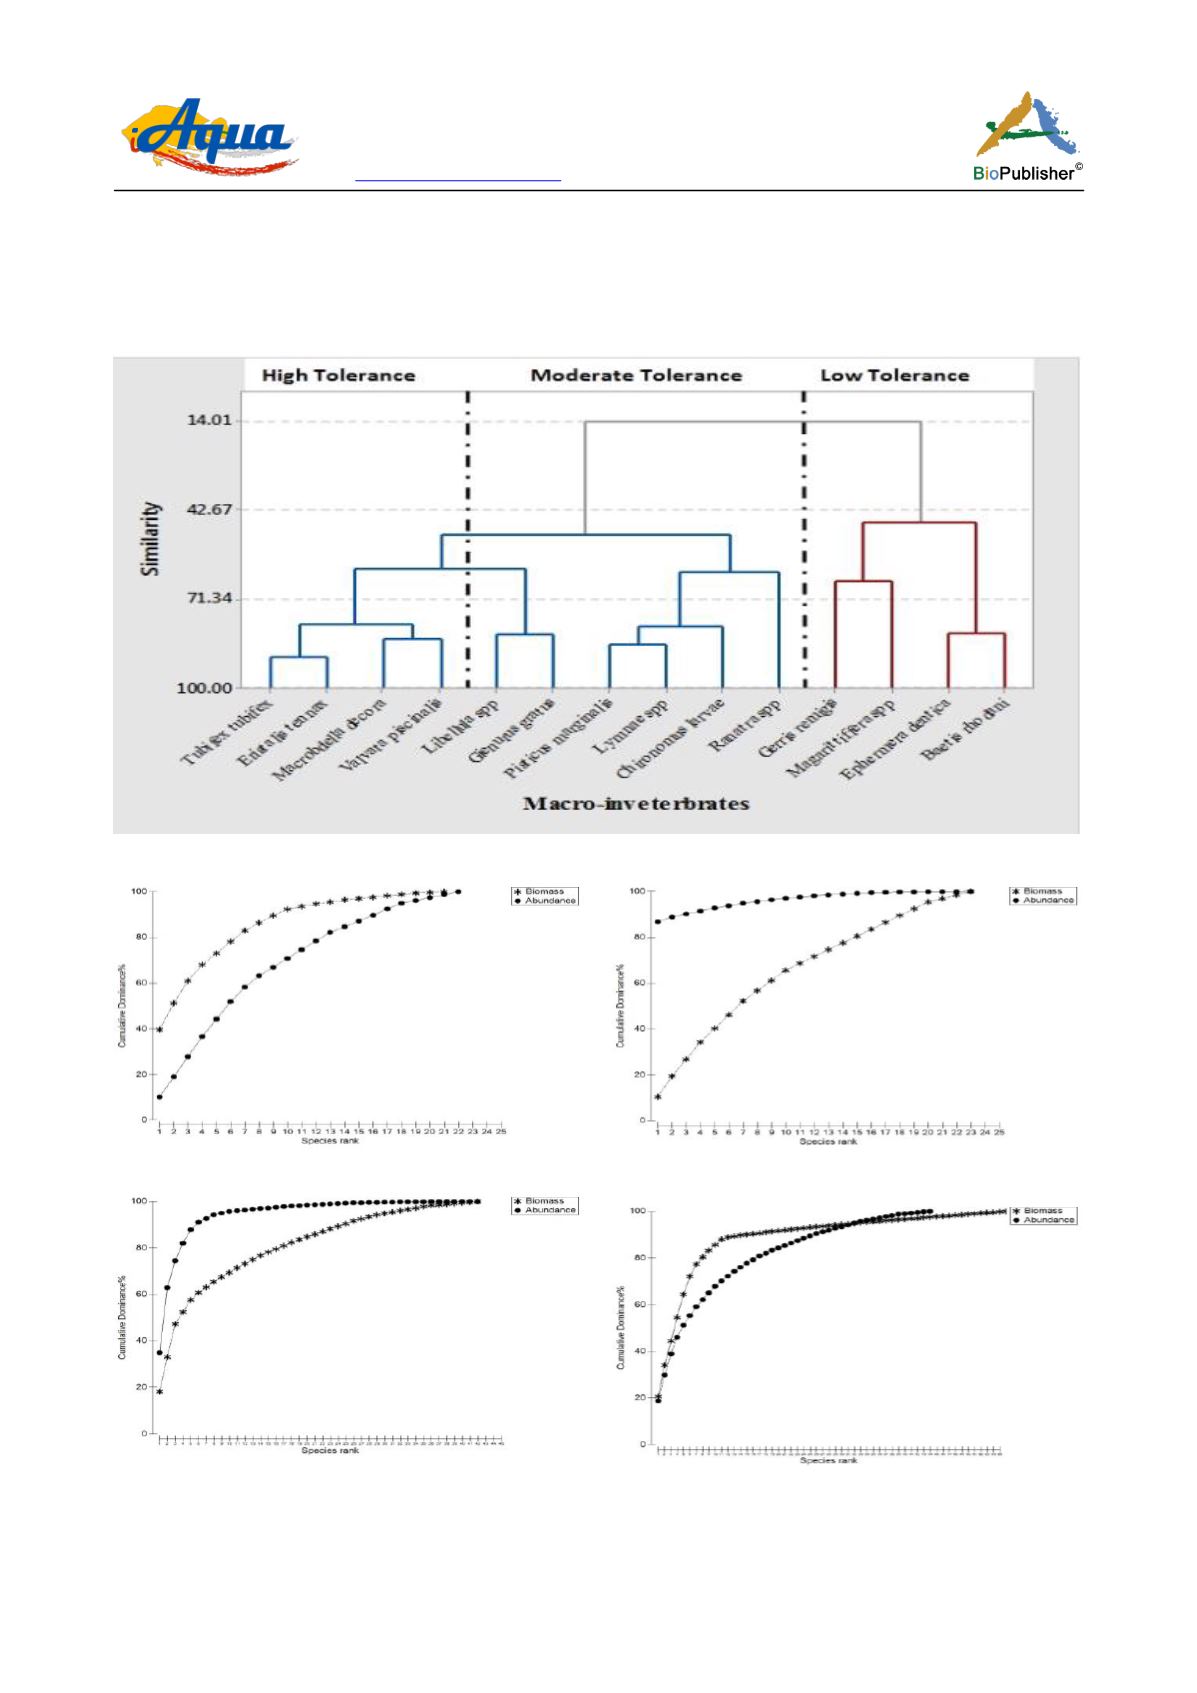
Station B showed disturbance (polluted condition), hence the curve for abundance lied above biomass with a wide
margin (Figure 4). Station C showed disturbance, hence the curve for abundance lied above the biomass curve.
The margin indicating the extent of pollution was however not as wide as that in station B (Figure 5). Station D
showed relatively polluted condition. Hence, the curve for biomass overlapped the abundance curve with a narrow
range (Figure 6).
Figure 2 Dendrogram showing the classification of Macroinvertebrates based on their tolerance to Wurukum Abattoir Effluent
Figure 3 Abundance biomass comparison curve station A
Figure 4 Abundance biomass comparison curve for station B
Figure 5 Abundance biomass comparison curve for station C
Figure 6 Abundance comparison curve for station D


