International Journal of Aquaculture 2015, Vol.5, No.34, 1-7
2
of inorganic fertilizer and supplementary feed
(Desilva and Anderson, 1995).
2 Materials and Methods
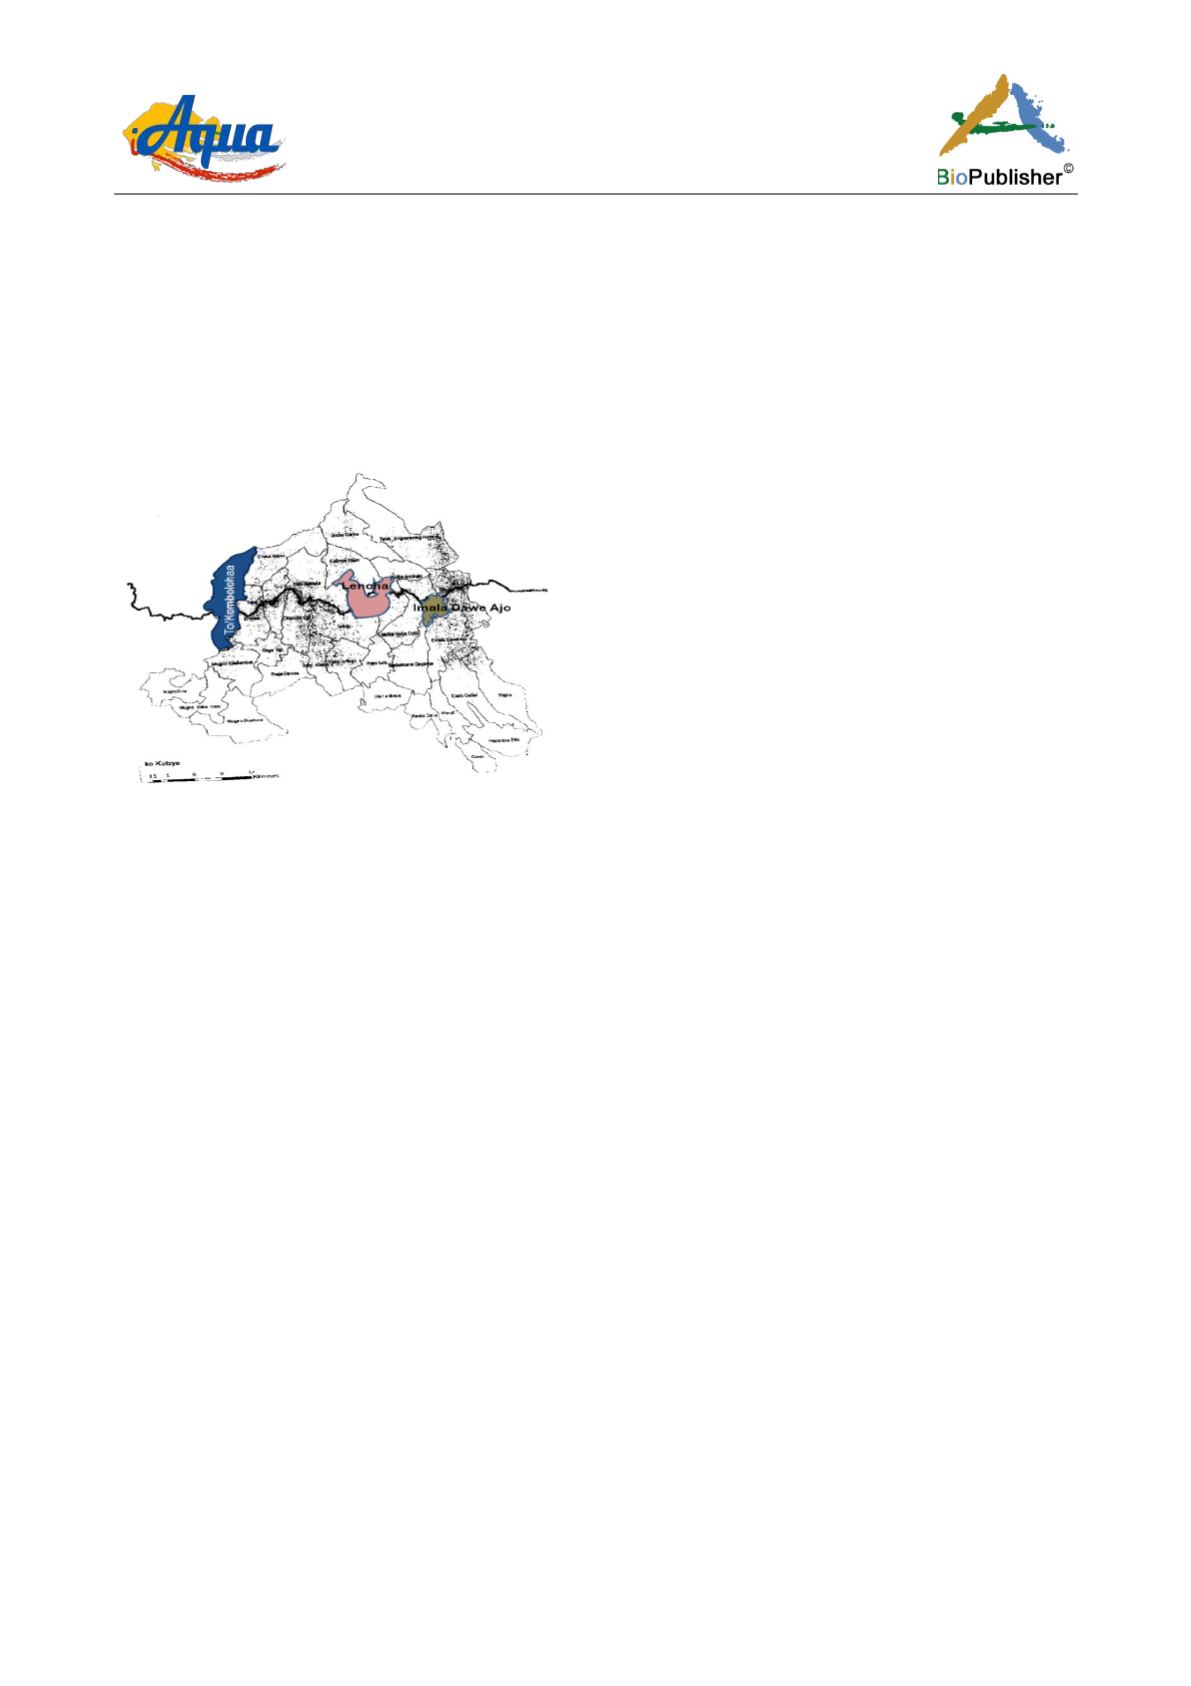
2.1 Description of the study area
The study was conducted in the ponds located in Toke
Kombolcha, Lencha and Imala Dawe Ajo, Toke
Kutaye Woreda of Oromia Regional state, Ethiopia
(Figure 1).
Figure 1 Map of Toke Kutaye Woreda (Woreda Agricultural
and Rural development office, 2011)
The study was conducted in three earthen ponds (110
m
2
each) located at the altitudes of 2,500 msl (P1),
2,100 msl (P2) and 1,710 msl (P3) respectively. The
pond bottoms were prepared and treated with lime for
15 days followed by fertilizing with cow dung (1kg
dry weight/m
2
/week) and filled with water up to 75
cm depth. Tilapia fingerlings with known initial body
length and weight were introduced (2 fingerlings/m
2
)
in to the ponds. Supplementary feed (75 % wheat bran
and 25 % noug cake) was given at the rate of 3 % of
body weight. The different growth parameters were
measured by following standard methods (Desilva
and Anderson,1995).Water samples were collected
every fortnight for the estimation of physico-chemical
parameters following standard procedures(Strickland
and Parsons, 1972; Trivedi and Goel 1984). The
nitrate and total phosphorus content were determined
following the spectrophotometric method(Tandon,
1993; Olsen et al., 1954). Water samples were
collected using a 5 liter Schindler-Patalas water
sampler and filtered through a 20µm bolting silk net
and preserved with Lugol's solution for enumeration
of phytoplankton by using identification keys
(Whitford and Schumacher, 1973; Green, 1986,
Talling, 1987). Abundance of plankton population
was estimated as individual m
-3
following the method
of (Edmondson and Winberg, 1971).
3 Results
3.1 Average individual body length and weight
Length and weight of tilapia fingerlings is presented
in table 1 and 2. The initial body length (IBL) and
initial body weight (IBW) were found to be 5±0.03
cm and 5.7±0.02 gm respectively. The final body
length (10.1 cm) was observed in P3 after 120 days
of culture and it was 8.1 cm in P1 situated at highest
altitude(Table1). The maximum final body weight
(IBW) noticed was 63.7±0.50 g in P3while it was
52.4±0.57g in P2 and 18.2±0.02g in P1.
Statistical analysis showed significant difference
(P<0.05) for average individual body weight among
all the treatments (Table2).
3.1.1 Average body weight gain
Average body weight gained by fish in ponds located
in different altitudes was 0.2±0.03, 1.2±0.05 and
3±0.09 g/fish in15 days. The values increased during
the study period and reached 2.6±0.03, 10.1±0.78 and
12.3±0.53 g/fish at the end of the experiment (120
days) in P1, P2 and P3, respectively (Table 3). The
values of average body weight gain among all ponds
showed significant differences (P<0.05).
3.1.2 Specific growth rate (SGR)
Changes in SGR value of
O. niloticus
at the end of the
experiment were 1.0±0.23, 1.2±0.11 and 1.4±0.06 %
at the altitude of 2,500, 2,100 and 1,710 msl
respectively(Table4). The highest mean growth rate
was recorded in P3 and the minimum in P1. The
observed SGR were significantly different (P<0.05)
between the ponds.
3.2 Physico-chemical parameters
During the study period all the important water
quality parameters in the three ponds were analyzed.
Of which only variations in temperature, nitrate and
total phosphorus showed distinct variations in the
ponds and are for discussion in this paper.


