基本HTML版本


Bioscience Methods 2014, Vol.6, No.1, 1-13
http://bm.biopublisher.ca
9
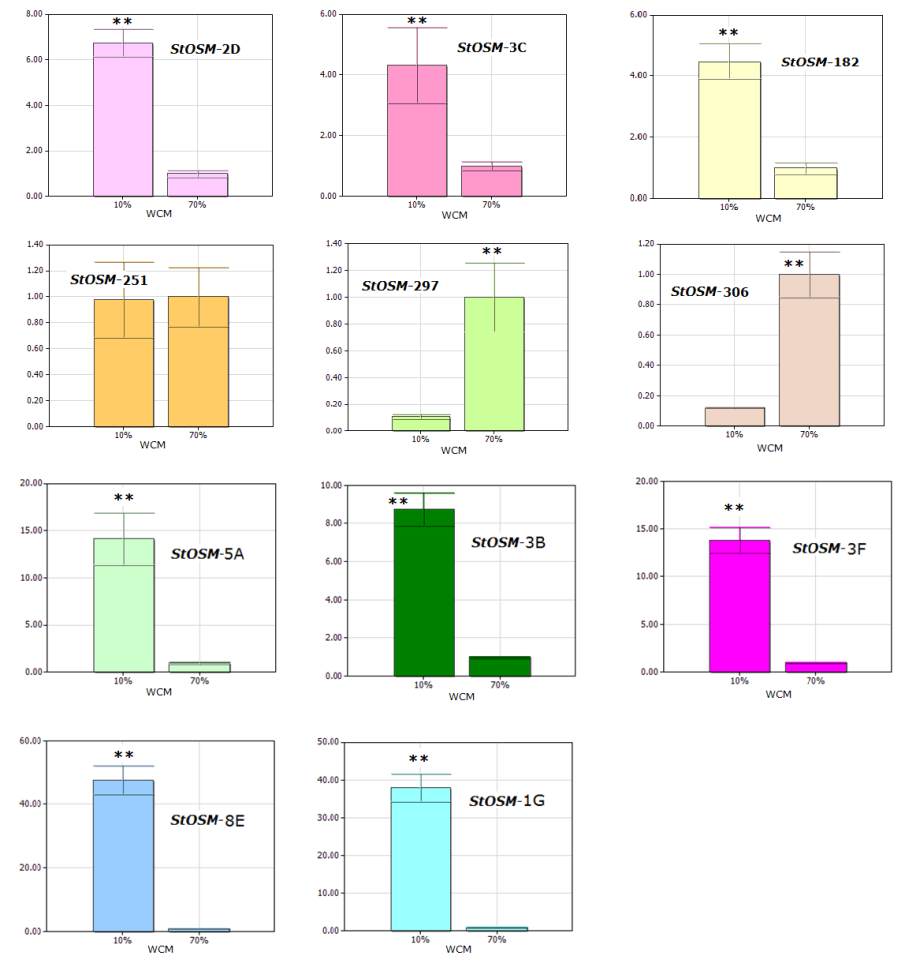
Figure 10 Comparison of the relative levels of
StOSM
transcripts in leaves. The potato species
S. tuberosum
ssp.
ZHB
, was grown
under 10%±2% WCM as the treatment and under 70%±5% as the control. The relative levels of the
StOSM
transcripts are given on
the
y
-axes and were quantified using total RNA extracted from new leaves (leaf) from plants grown under 10% WCM (or DLP) as
the water stress condition or under 70% WCM as the control condition. Leaf samples under water stress were harvested when the
water content reached the expected level based on the water content in the media, which was regularly monitored every 12 hours.
Real-time qRT-PCR with gene-specific primers was used to calculate the relative amounts of RNA for each
StOSM
gene. The
expression of each
StOSM
gene was calculated as the 2
−ΔCt
value and normalised to the endogenous reference gene, beta-actin
.
The
standard errors of the means of three biological replicates are shown, with asterisks indicating significant differences (**
P
<0.01) by
Student’s
t
-test
A recent study in animals showed that plant osmotin
can activate a pathway involved in disease resistance
by binding to the adiponectin receptors. Through the
upregulation of the antiapoptotic Bcl-2 protein, plant
osmotin reduces ethanol neurotoxicity and reverses
synaptic dysfunction and neuronal apoptosis (Naseer
et al. 2014 and Shah et al. 2014).
The functions of plant osmotin in animal cells may
provide a clue to understand how osmotin in plant