Animal Molecular Breeding 2015, Vol. 5, No. 1, 1-8
5
2.2
Genetic diversity of Archachatina marginata
The RAPD banding patterns of the sixteen (16)
accessions are illustrated in Figure 1. The 3 primers used
for PCR – RAPD fingerprinting were able to amplify the
DNA from fifteen (15) out of the sixteen (16) snail
accessions examined. A total of 84 bands were observed
from these 15 accessions using the 3 primers. Out of the
amplified products, 79 were found to be polymorphic
with an average of 28 bands per primer. The number of
bands produced per primer ranged from 26 (for OPB 03)
to 30 (for OPB 04). Of these, the percentage of
polymorphic bands was 85.90% (Table 4).
Table 4 Details of total number of bands and number of polymorphic amplicons/primer
Primer
Sequence 5′
-
3′
Total number of bands
Number of polymorphic bands
OPB
-
03
CATCCCCCTG
26
23
OPB
-
04
GGACTGGAGT
30
30
OPB
-
08
GTCCACACGG
28
29
TOTAL
84
79
2.3
RAPD polymorphism resulting from OPB 03
Twenty-six (26) scorable RAPD fragments were
generated from amplification of genomic DNA of
A.
marginata
(
N
= 16) with OPB-03. Three (3) fragments
accounting for 11.54% of overall bands were
monomorphic and were fixed in all investigated
samples. Twenty- three (23) fragments accounting for
88.46% of overall RAPD bands generated by OPB 03
were polymorphic (Figure 1).
2.4
RAPD polymorphism resulting from OPB04
Thirty (30) scorable RAPD fragments were generated
from the amplification of genomic DNA of
A.
marginata
(
N
= 16) with OPB-04. All the thirty
fragments accounting for 100% of overall bands were
polymorphic and fixed in all investigated samples
(Figure 1).
2.5
RAPD polymorphism resulting from OPB08
Twenty-eight (28) scorable RAPD fragments were
generated from amplification of genomic DNA of
A.
marginata
with OPB 08. Two (2) fragments accounting
for 7.14% of overall fragments were monomorphic;
twenty-six (26) fragments accounting for 92.86% were
polymorphic and fixed in all investigated samples
(Figure 1).
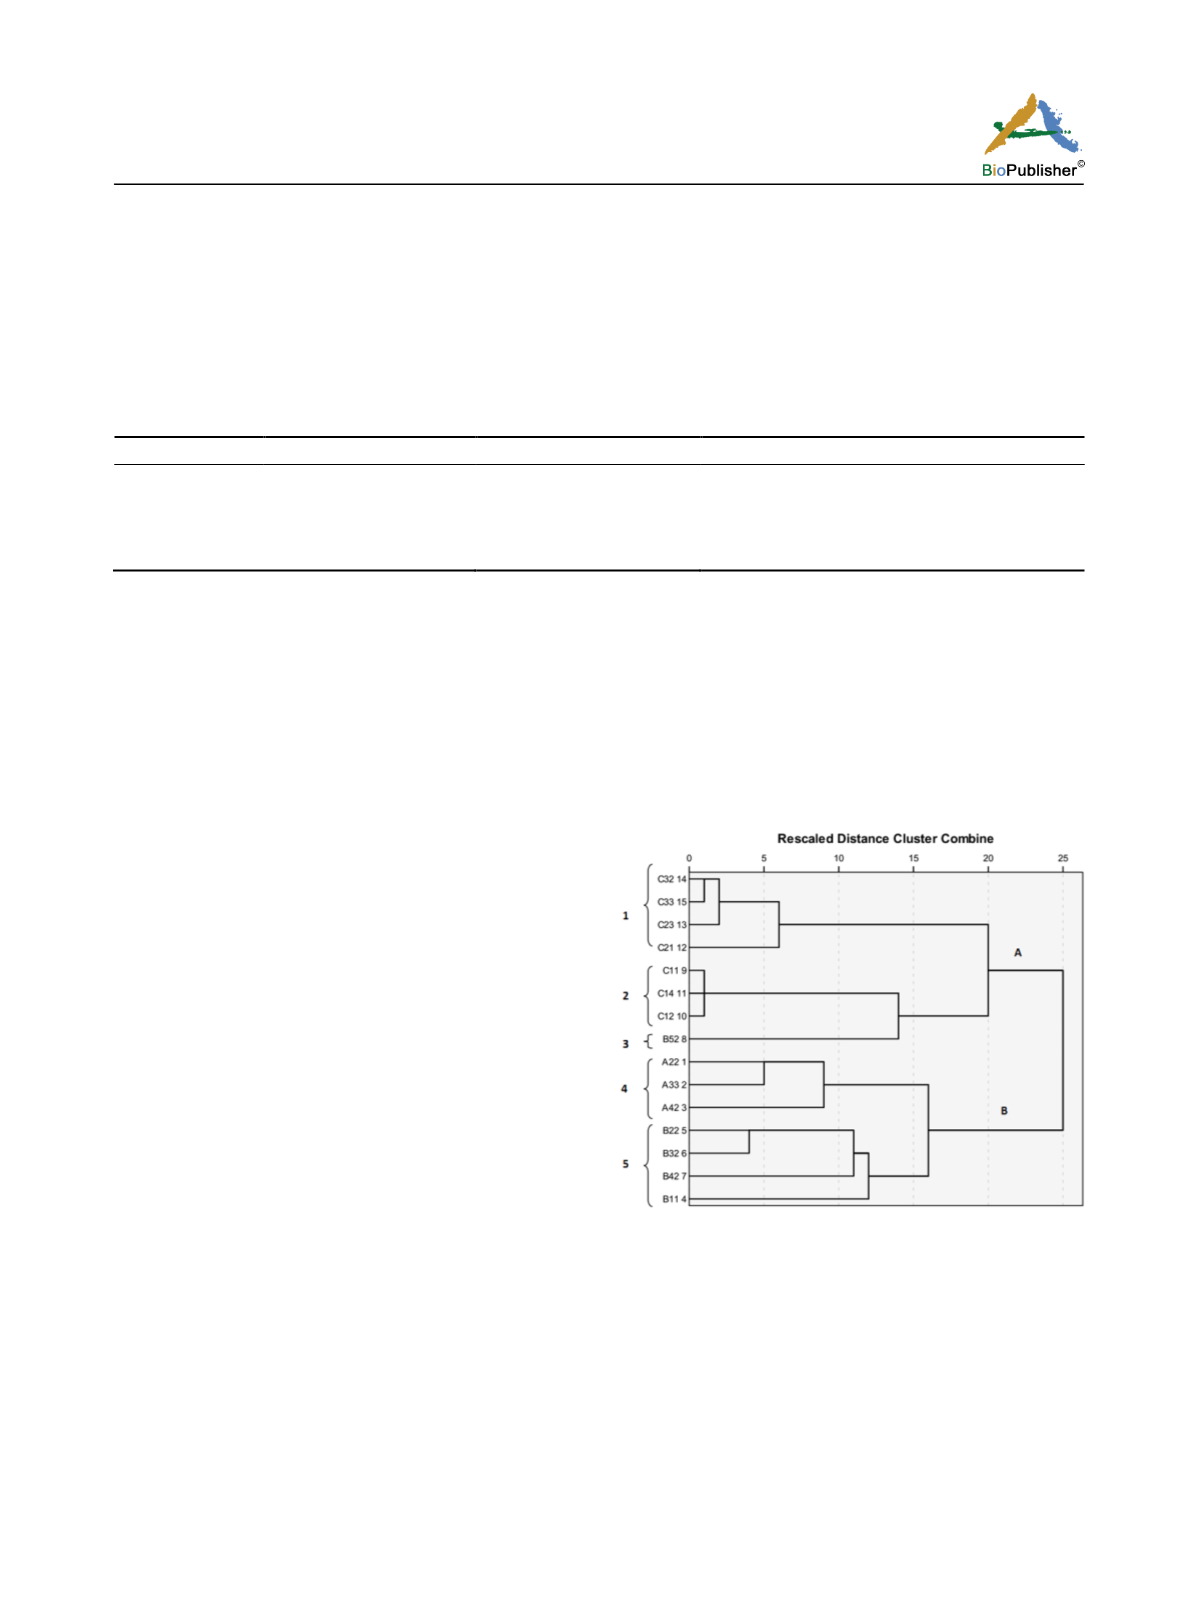
2.6 Genetic relationship
The genetic relationship among the accessions was
examined by UPGMA cluster analysis. The UPGMA
dendrogram (Figure 2) of the populations was
constructed based on Nei’s unbiased genetic distance
matrix. The dendrogram indicated that the five
populations were divided into two groups. One group
consisted of the individuals from populations A7 and
A8, and the other six populations were clustered in
another group that can be further divided into two
sub-clusters. A1 population was clustered into one
separate sub-group, and the other five populations (A2,
A3, A4, A5 and A6) constituted the other sub-group.
Figure 2 Dendrogram showing average linkage between groups
The relationship between genetic distance and
corresponding geographical distance among populations
was tested by Mantel’s Test, and the result shows that
there was no significant correlation (r = -0.1345, p =
0.71). This result showed that geographical distance
was not the main reason for the genetic differentiation
observed amongst the
A. marginata
populations
evaluated here.


