Basic HTML Version


Molecular Plant Breeding 2013, Vol.5, No.3, 10
-
17
http://mpb.biopublisher.ca
11
(Souframanien and Gopalakrishna, 2004). RAPD
markers have been successfully used to evaluate
genetic diversity in
Brassica
(Demeke et al., 1992;
Jain et al., 1994; Thormann et al., 1994; Bhatia et al.,
1995; Dulson et al., 1998; Zu and Wu, 1998; Divaret
et al., 1999), common wheat (Liu et al., 1999; Sivolap
et al., 1997), maize (Zhang et al., 1998; Bernado et al.,
1997), barley (Hamza et al., 2004) and sesame
(Salazar et al., 2007). The number of markers used,
their abundance in the genome and the degree of
precision with which the results are analyzed
determine the accuracy to distinguish the genotypes
(Schut et al., 1997). In the present investigation, we
analyzed 23
B. juncea
L. varieties cultivated in
Northern states of India using PCR based markers to
examine the efficiency of these techniques viz-a-viz
genetic diversity.
Results
A number of studies on genetic variation among
Indian mustard genotypes have been done; where
mostly RAPDs have been used (Ali et al., 2007;
Ahmad et al., 2009). Since the information on
EST-SSRs in public domain is limited (Hopkins et al.,
2007). Hence in the present study an attempt was
made to determine genetic diversity among
B. juncea
genotypes cultivated in Northern states of India using
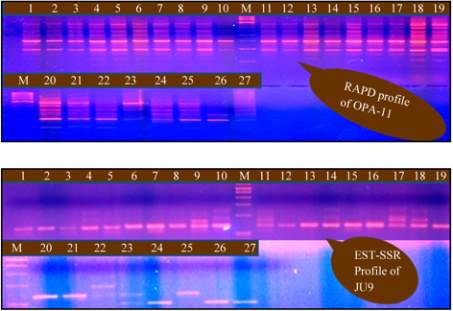
RAPDs (Figure 1A). Moreover, we tested few
EST-SSRs, for polymorphism selected from Hopkins
et al. (2007) (Figure 1B). Here we observed that,
polymorphism shown by EST-SSRs was much less
compared to RAPDs. So the detailed study of only
Figure 1 A: RAPD profile for OPA-11 primer; B: EST-SSR
profile for JU 9 primer
reproducible RAPDs was done. The total number of
bands, polymorphic bands and monomorphic bands
were counted from the RAPD profiles of 15
reproducible primers. The Polymorphism percentage,
PIC, marker index and resolving power for each
RAPD was calculated to depict their discriminatory
power as represented in Table 1. A total of 260 bands
were produced with an average of 17.33 per primer,
among which 236 bands were polymorphic having an
average of 15.73 per primer. The number of amplified
fragments varied between 13 for OPE-01 to 23 for
OPA-10 and the amplicon size varied from 150 bp to
2750 bp. The highest number of polymorphic bands
viz. 21 bands for OPA10 primer followed by 19 for
OPC-08 and 18 for OPE-03, whereas OPE01
produced the least polymorphic bands corresponding
to 11. Twenty one unique bands were recognized out
of 236 polymorphic bands. High number of unique
bands corresponding to six from OPA-10 and three
from OPA-07. However, two bands for OPC-02 and
OPA-11 and one unique band each from OPA-03,
OPA-05, OPB-10, OPC-08, OPD-07, OPD-18, OPE-01
and OPE-02 were observed. Polymorphic information
content with an average of 0.30, ranged from 0.20 (for
OPE-01) to 0.39 (for OPC-02 and OPE-03). Higher
PIC was observed for OPC-08, OPA-09, OPB-10,
OPA-02 and OPA-10 where as EST-SSRs showed
comparatively very less values ranging from 0.173 to
0.29. Highest resolving power was obtained with the
primers OPE-03 (10.71), OPA-10 (9.92) and OPC-08
(9.98) where as least were observed for OPE-01 (3.15)
and OPA-07 (3.88). On an average, 4.44 and 6.89
values were obtained for marker index and resolving
power respectively. We observed a significant positive
correlation between PIC, resolving power and marker
index. Based on all these parameters, RAPDs
(OPE-03, OPC-08, OPA-10) were considered best for
assessing diversity among
B. juncea
genotypes.
However, OPE-01 was least efficient. Primer OPC-02
showed a high value for all the parameters but it was
not able to reproducibly resolve all the genotypes.
Further, cluster analysis was done using STATISTICA
program, based on UPGMA. The genotypes were
grouped in 2 major clusters having linkage distance of
10.8 U. The cluster I as represented in Figure 2,
includes four genotypes which are grouped in two