Basic HTML Version


Legume Genomics and Genetics 2012, Vol.3, No.1, 1
-
7
ht
t
p://lgg.sophiapublisher.com
5
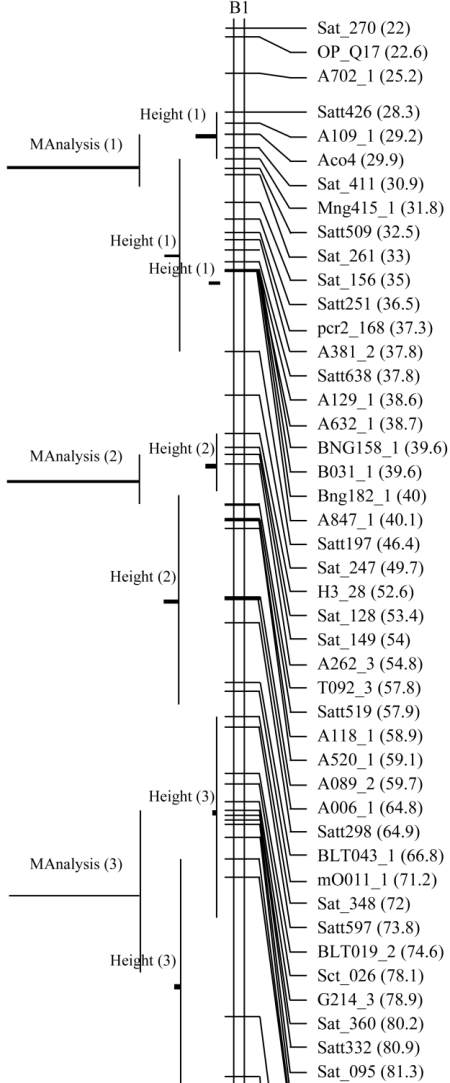
Figure 2 Meta-analysis of height QTLs on LG B1
methods, the method of meta-analysis was used to
integrate and obtain the major QTL, shrink the
confidence interval, and improve the accuracy and
validity of QTL position. In present study, 78 QTLs of
height that have been reported were collected, and
56 QTLs were integrated. In the end, 12 consensus
QTLs and their corresponding markers were obtained
respectively. 3 QTLs were detected twice or more
times by CIM and MIM on LG B1, LG D1a and LG G
and furthermore used in Meta-analysis. The minimum
CI was shrunk to 0.24 cM and false positive decreased
greatly. According to this result, it is better to select
markers covering the target segment for fine-mapping
and gene mining, the real QTL is important for
researching on improving soybean yield.
3 Materials and Methods
3.1 Materials and methods for QTL mapping
3.1.1 Plant materials and experimental design
A total of 149 F
2:14
-
F
2:16
population derived re-
combinant inbred lines (RILs) were advanced by
single-seed-descent from crosses between ‘Charleston’
(provided by Dr. Lijuan Qiu, Chinese Agricultural
Academy of Science, Beijing, China) and ‘Dongnong-
594’ (developed by Northeast Agricultural University,
Harbin, Heilongjiang, China). RILs were planted in
experimental land of the Crop Research and Breeding
Center of Land-Reclamation in Harbin between 2006
and 2008. The plants were cultured in a randomized
experimental single-row plot (1 m in length and 0.5 m
in width) for two or three repeats. The timing and
frequency of cultural management procedures for the
trials were consistent with soybean production practices
under their respective environments. In our study, the
RIL population was performed in duplicate in 2006
and 2007, whereas it was performed in triplicate
during 2008.
3.1.2 Measurement of soybean height
Five plants of each line were randomly harvested and
used for the phonotype values calculation. According
to the “Bean Germplasm Description Specifications
and Data Standards”, measurement of plant height was
performed by distance from cotyledon section to the
top of the main stem each plant in soybean maturity,
and an average of five replications was used.
3.1.3 Statistical analysis
The linkage map of RIL population was constructed
by Zhang (2004). QTLs under different environments
were separately mapped by software Windows QTL
Cartographer Ver. 2.5. QTL position was determined