Basic HTML Version


Legume Genomics and Genetics 2012, Vol.3, No.1, 1
-
7
ht
t
p://lgg.sophiapublisher.com
2
years. Psychologist Glass (1976) firstly widely used
Meta-analysis in physic, sociology, and behavioral
science, integrated and obtained the better result
conveniently. Goffinet and Gerber (2000) used meta-
analysis to increase their precision and validity by
mathematical model to refine integrated QTLs. In
soybean, Guo (2006) integrated 62 QTL associations
for resistance to soybean cyst nematode in soybean
and obtained 10 consensus QTLs and the corresponding
markers. Qi (2009) integrated and analyzed 65 QTLs
for soybean 100
-
SW, and 12 consensus QTLs and the
corresponding markers have been obtained. These
results laid the foundation for marker-assisted
selection (MAS) and gene cloning in soybean.
In the present study, we aimed to detect real QTLs
under different environments. Using genetic statistics
software Windows QTL Cartographer Ver. 2.5 (Wang
et al., 2007), we constructed a set of soybean height
from the RILs in 2006~2008, which was used to study
the consistency of QTLs across places and years as
well as to detect real QTLs. We collected the
information of mapping QTLs from the present study
from many different populations and environments.
Finally, we integrated these data to the reference map,
12 consensus QTLs of soybean height were obtained,
which could be used for MAS of soybean height.
1 Results and Analysis
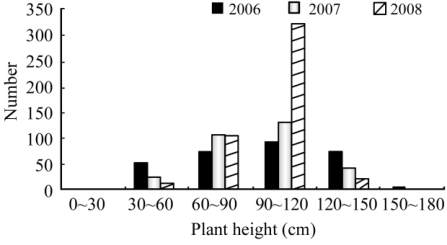
1.1 The phenotypic information in RIL
The phenotypic results of RIL population between
2006 and 2008 were shown in table 1. The difference
of maternal parent in height was significant. All plant
height data displayed a typical quantitative genetic
model-approximate normal distribution, and it was
suitable for QTL mapping (Figure 1).
1.2 QTL mapping of height in RILs
Based on the mixed linear model approach, we
analyzed the data of soybean height in 2006~2008,
Figure 1 The frequency distribution of soybean height of RIL
population in three years
including CIM (Composite Interval Mapping) and
MIM (Multiple Interval Mapping) methods. In this
population, 4 QTLs were detected by CIM, and
another 11 QTLs were detected by MIM (Table2,
Table 3). Compared with different mapping methods,
CIM and MIM detected twice or more times QTLs on
LG B1, LG D1a, LG G, the CI deviation was small, so
the real QTLs could exist on these LGs. The explained
variation of all QTLs ranged from 4.00% to 59.70%
with a LOD-value between 3.04 and 10.1. On LG B1,
QphB1
-
1
was mapped between Satt509 and Satt229,
its CI was 192.9~254.8 cM, explaining about 39.00%
of the variation with an additive effect of 9.69;
QphB1
-
2
and
QphB1
-
3
were mapped between Satt251
and Satt229, CIs of them were 192.6~261.5 cM and
261.5~329 cM, explaining about 59.70% of the
variation with an additive effect of 12.20;
QphB1
-
4
,
QphB1
-
5
, and
QphB1
-
6
were mapped between
Satt509 and Satt197, Satt197 and Satt251, Sat_099
and Sat_113, CIs of them were 83~121.6 cM,
135~185.9 cM, and 356.5~422.2 cM, with the same
additive effect of 12.20. On LG D1a,
QphD1a
-
1
was
mapped between Sat_062 and Sat_106, CI was
198.9~206.3 cM, explaining about 10.0% of the
variation with an additive effect of
-
10.53;
QphD1a
-
2
was mapped between Sat_062 and Sat_106, its CI
was198.4~207.7 cM, explaining about 9.10% of the
Table 1 The height of the parents of RIL population between 2006 and 2008
Traits
Year
Parents
Population
Charleston (maternal
parent) (cm)
Dongnong 594 (paternal
parent) (cm)
Mean
(cm)
SD
Max
(cm)
Min
(cm)
Kurtosis Skewness
Height 2006 43.0
95.2
92.39
32.57
166.0
31.2
-
0.45
-
0.240
2007 66.4
94.0
93.84
22.60
139.6
43.2
-
0.38
-
0.155
2008 90.4
115.0
96.69
14.50
140.8
48.8
0.48
-
0.560