Basic HTML Version


Molecular Soil Biology (online), 2011, Vol. 2 No.1, 1
-
8
ISSN1925-2005
http://msb.sophiapublisher.com
- 3 -
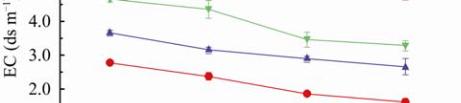
Figure 1 Soil EC (0~8 cm) dynamic variation of four
treatments (T1, T2, T3 and T4) and ck at different periods
Note: Each datum point is the mean of six measurements
with SD; The sample times are: 7 d: 7 days after salt
treatment; 40 d: 40 days after planting; 70 d: 70 days
after planting, which is also cucumber full bearing age;
and 77 d: 7 days after full harvest
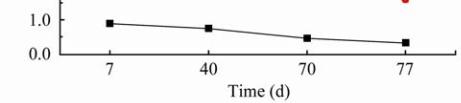
Figure 2 Height of cucumber plants for 5 treatments at different
times
Note: p10, p20, p30, p40, p50, p60, p70: The day after planting
10 d, 20 d, 30 d, 40 d, 50 d, 60 d, 70 d; Each datum point is the
mean of six measurements with standard deviation
in treatments were lower than those of ck at each
sampling time. The heights of T1, T2, and T3 at
the end of the experiment had decreased by 33.5%,
56.0%, 66.7% compared to ck, respectively
(Table 2). The Y/P, WSF values for T1, T2, and
T3 decreased significantly compared to those of
ck (
p
<0.05) (Table 2). The Y/P reduced by 12.3%,
31.7% and 61.9% for T1, T2, and T3 respectively.
The same trend of weight per fruit (WSF)
occurred with the increasing salinity. The WSF
decreased 13.0% for T1, 26.7% for T2 and 47.1%
for T3. The difference of the fruit number per
plant between treatments was not significant.
1.4 Cucumber fruit quality
The parameters of cucumber quality including fruit
VC, total soluble sugar content (TSC), total soluble
protein (TSP) and crude fiber (CF) were studied
(Table 3). In generally, the quality parameters except
TSC, CF and TSP in treatments were higher than
those of the ck, while VC decreased with the increase
of salinity in soil.
2 Discussion
2.1 The relationship between Soil NO
3
-
contents
and EC
With the growth of the cucumber, NO
3
-
contents of the
ck and treatments decreased. The reduction might be
due to the uptake by plants and the infiltration into
deeper layers (Shi et al., 2009). Soil initial NO
3
-
increased with the enhancement of nitrate in the soil.
It was found that there were significant relationships
between NO
3
-
contents and top soil EC (Table 4).
These results implied that the change in soil quality
Table 2 Cucumber height, fruit yield, number and weight in ck and treatments (n=6, means ± SD)
Treatments
Item
CK
T1
T2
T3
Height (cm)
Stem diameter
110.33±2.87a
1.64±0.04a
93.48±3.10b
1.57±0.04b
72.15±1.64c
1.50±0.01c
66.78±2.96d
1.40±0.04d
TY(kg)
24.58±1.33a
21.36±1.56b
16.78±0.94c
9.34±0.41d
Y/P (kg)
1.76±0.09a
1.53±0.11b
1.29±0.08c5
0.93±0.15d
NF
8
8
8
8
WSF(g)
220.00±11.50a
191.3±13.5b
161.3±10.3c
116.3±18.6d
Notes: TY: Total yield per treatment; Y/P: fruit yield per plant; NF: Number of fruits per plant; WSF: Weight of single fruit; Letters
(a, b, c, d) represent the test results of different significance at the 0.05 level