Basic HTML Version


Molecular Plant Breeding 2012, Vol.3, No.3, 26
-
36
http://mpb.sophiapublisher.com
29
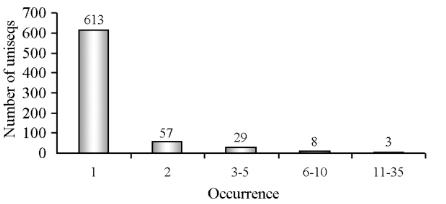
1.4 Expression abundance of EST sequences
The EST numbers of the same gene obtained by
randomly sequencing represent the expression abun-
dance of the gene in the specific tissues and organs to
a certain extent. Generally, the cell specific genes are
expressed at a high level, while the expression of most
house-keeping genes is in low abundance. There were
16 repeats in high quality ESTs, which represented
1.64%. When analyzed using BLAST after removing
the repeats, there were 17 genes with high abundance
(expression frequency
≥
5), 80 medium abundance
genes (expression frequency 2~5), and the rest were
all in low abundance (Figure 5). The results indicated
that the majority of genes were expressed in low
abundance.
Figure 5 The frequency of occurrence of uniseqs derived from
spliced EST
1.5 Grape pericarp ESTs with similarities to known
sequences
Comparing with non-redundant database on NCBI
website using BLASTX, the ESTs were divided into
different groups based on their functional annotations.
The homologies of ESTs have significant similarity in
gene structure and functional characterization. There
were 710 unigenes annotated. Among the 710 unigenes
analyzed, 64.65% showed strong similarity (BLAST
score
>
80) with known or unknown functions in the
public database, and 9.44% showed marginal
similarity (80
>
BLAST score
>
40). Therefore, 528
had either strong or weak homology to previously
identified genes, which represented 722 ESTs with the
percentage of 74.13% in the valid EST sequence. Of
the 528 unigenes, 270 were characterized with known
functions or putative functions, and there were 258
annotated with unknown functions. 25.87% of the
analyzed unigenes did not match with any sequences
in database. Some of these genes could actually be the
key enzymes in biosynthesis pathway or the critical
factors for controlling veraison, which is still deeply
investigated and not fully understood at the molecular
level (Table 2).
Table 2 Selected set of specific sequences and their putative functions
Functional class
Unigene ID
Putative annotation
Energy/metabolism
gppca0_0006_B01.ab1
Aconitase A
gppca0_0007_F11.ab1
UDP-glucose: flavonoid 3
-
O-glucosyltransferase
gppca.CleanEST.seq.Contig5
Flavonoid 3'5' hydroxylase
gppca0_0010_A06.ab1
Chalcone synthase
gppca0_0001_B08.ab1
Alcohol dehydrogenase 2
gppca.CleanEST.seq.Contig92
Cytochrome P450 like_TBP
gppca.CleanEST.seq.Contig32
Dtdp-glucose 4
-
6
-
dehydratase
gppca.CleanEST.seq.Contig121
Ripening-related protein-like
gppca0_0008_C09.ab1
Lactate dehydrogenase
gppca0_0006_E03.ab1
Isocitrate dehydrogenase
gppca0_0003_F03.ab1
Acetyltransferase
gppca0_0003_E04.ab1
Pyruvate kinase
gppca0_0006_C11.ab1
Predicted O-methyltransferase
gppca.CleanEST.seq.Contig89
Glycosyltransferase
gppca0_0013_B09.ab1
Acyl dehydratase
gppca0_0010_E06.ab1
ATP binding
gppca0_0010_A09.ab1
Aminopeptidase N
gppca.CleanEST.seq.Contig30
Isopenicillin N synthase
gppca0_0010_G07.ab1
Phosphopantothenoylcysteine decarboxylase