Basic HTML Version


Molecular Plant Breeding 2012, Vol.3, No.2, 11
-
25
http://mpb.sophiapublisher.com
15
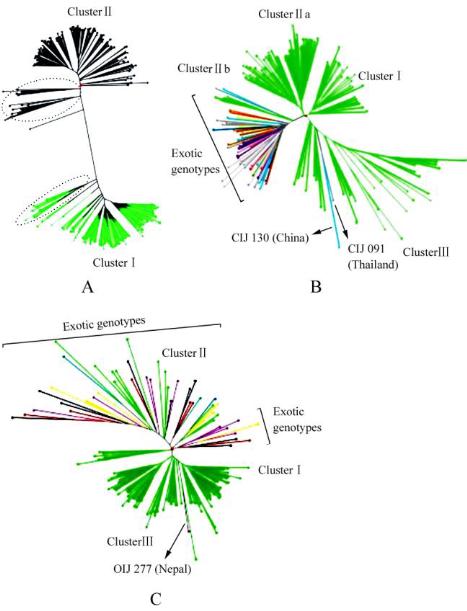
Figure 2 Un-weighted neighbor-joining dendrograms of jute
genotypes
Note: A: 292 jute genotypes including genotypes of
C. capsularis
(cluster
Ⅰ
, green lines) and genotypes of
C. olitorius
(cluster
Ⅱ
,
black lines); the circled regions indicate grouping of genotypes
of the two species together; B: 152 genotypes of
C. capsularis
;
C: 140 genotypes of
C. olitorius
; Green lines indicate
indigenous genotypes and lines with other colours (except
green) indicate exotic genotypes in both B and C; Arrow-headed
dotted lines indicate exotic genotypes which clustered with
indigenous genotypes in both B and C
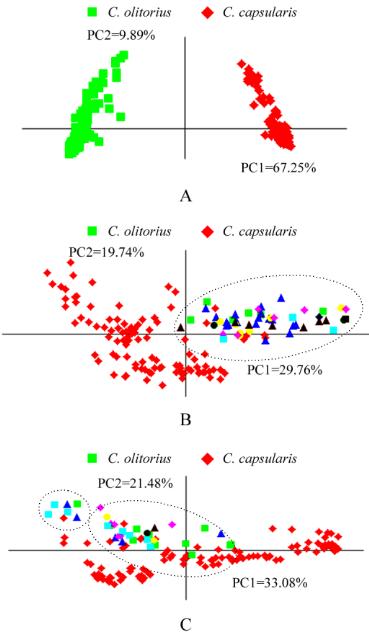
variation in
C. capsularis
and 33.08% and 21.48% of
the total variation in
C. olitorius
. The grouping of
genotypes in all the three PCA plots was largely in
agreement with those observed in UNJ dendrograms.
In the PCA plots of the two species, three groups
each corresponded to the three clusters of the UNJ
dendrograms (Figure 3b and 3c).
1.4 Analysis of molecular variance (AMOVA)
The results of AMOVA indicated that proportion of
variation between the two jute species accounted for
most (63%) of the molecular variance and only 37%
of the variance accounted for variation within each
species. The genotypes of both
C. capsularis
and
C.
Figure 3 Principal coordinate analysis based on SSR markers
showing distribution of jute genotypes
Note: A: all 292 jute genotypes, where genotypes belonging to
two species are grouped separately; B: distribution of 152
genotypes of
C. capsularis
; C: distribution of 140 genotypes of
C. olitorius
; The indigenous genotypes are represented by red
symbols while genotypes in circled region indicate only exotic
genotypes represented by other coloured symbols in both B and C
olitorius
were sub-grouped according to their country
of origin into indigenous and exotic collections and
for partitioning the genetic variation among the
collections of genotypes of both the species, AMOVA
was performed (Table 4). The variation among the
genotypes within indigenous and exotic collections in
each of the two species was 7
-
9 times higher than the
variation between the indigenous and exotic collections
(Table 4).
1.5 Genetic differentiation within indigenous and
exotic collections of genotypes in the two jute
species
A comparison of diversity statistics within the indigenous
and exotic collections of genotypes separately for the
two species is presented in Table 5. The values of
I