Basic HTML Version


Molecular Plant Breeding 2012, Vol.3, No.2, 11
-
25
http://mpb.sophiapublisher.com
19
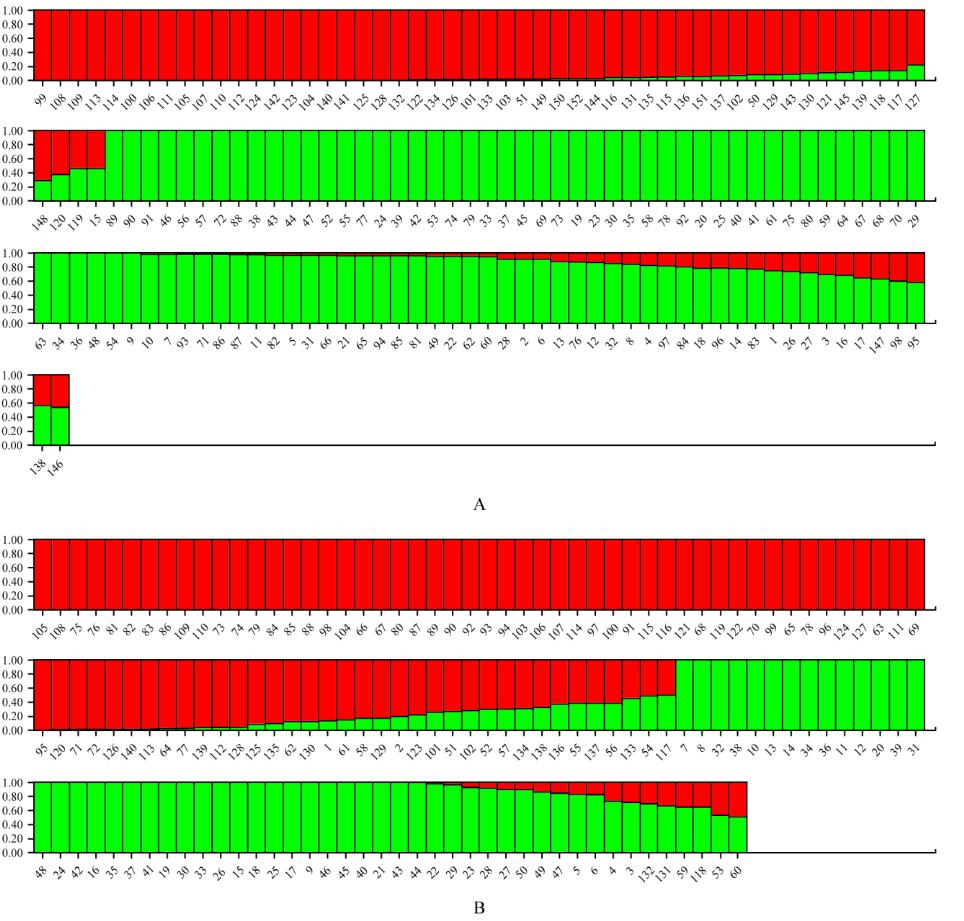
Figure 5 Assignment of each of jute genotypes
Note: (A) 152 genotypes of
C. capsularis
and (B) 140 genotypes of
C. oltorius
to two genetic groups or sub-populations using
STRUCTURE software. Each solid bar represents single genotype. The bars having two different colours (red and green) represent
genotypes belonging to two different sub-populations. Red = CI in (A) and OI in (B), Green = CII in (A) and OII in (B). The bars
having two colours represent genotypes showing admixture. The Y-axis displays the estimated ancestry of each genotype to a
particular sub-population
utilized for the study of genetic diversity, preparation
of molecular maps, QTL analysis and association
mapping in our laboratory. In the present study, we
used a set of 167 SSRs developed from the genomic
DNA of
C. olitorius
to study genetic diversity in 292
genotypes of two cultivated and cross-incompatible
species of jute, namely
C. capsularis
and
C. olitorius
.
2.1 Polymorphism and cross-species amplification
of SSRs
The cross-species amplification of SSRs derived from
C. olitorius
, in
C. capsularis
observed during the
present study is slightly higher (90.69%) than that
reported in our earlier study (~88%; Mir et al., 2008b).
Cross-species amplification of SSR loci (or transfera-