Basic HTML Version


Dong et al., 2011, Preliminary mapping of soybean dominant locus
Hrcs7
conferring resistance to
Cerocospara sojina
race 7, Molecular Plant Breeding Vol.2
No.6 (doi: 10.5376/mpb.2011.02.0006)
39
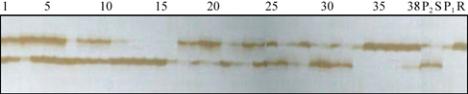
Figure 2 DNA amplified products for the SSR marker Satt384
Note: P
1
: ‘Gang95144-1’; P
2
: ‘Gongjiao9723-6’; R: resistant
DNA bulk; S: susceptible DNA bulk; 1~38 some plants among
F
2
population derived from the cross of ‘Gang 95144-1’
בGongjiao 9723-6’
Analyzed based on the Mapmaker3.0 software, it was
found that Satt411 and Satt384 were linked with the
resistant locus. The linkage order and distance was
satt384
-
5.7cM
-
satt411
-
7.9cM –Hrcs7. (Figure 3) .
Based on the Cregen
’
s genetic linkage map of soybean
(Cregen, 1999), the resistant locus was located in E
linkage group.
Figure 3 The position of resistant locus to soybean Cercospora
leaf spot Race 7 integrated into the Cregen
’
s genetic linkage
map of soybean
2 Discussions
Genetics of plant-pathogen interactions specify that
plants often contain single dominant resistance genes
that specifically recognize pathogens that contain
complementary avirulence genes (Flor, 1971). Our
results showed that one major dominant gene in ‘Gang
95144-1’ confer resistance to
C. sojina
race 7, which
was consistent with those reported on the resistance to
C. sojina
race 7 and race 1 in China (Yang et al.,1995;
Zhou et al.,1998; Zhang et al, 2004)
,
as well as other
races in America (Athow and Probst, 1952; Philips
and Boerma, 1982).
The genetic mapping result show the resistant locus
was located in E linkage group and linked with
satt411 and satt384, Which was different from the
MLG J of American Rcs3 (Mian et al., 1999) and
MLG C1 of china race 1(Zhang et al., 2004). It can be
speculated that the resistant genes to the different
races of
C. sojina
possibly distributed in different
genetics linkage groups. Together with resistance
controlled by one major dominant gene, we conclude
molecular markers assisted-polymerizing muti races
was relatively easy and was significant for the
improvement of resistance to frogeye leaf spot.
MLG E was also the cluster distribution of resistant
locus to soybean cyst nematode and
Sclerotinia
Sclerotiorum
. There were respectively 3 and 2 QTL
distributed in MLG E (Guo et al., 2006; Guo et al.,
2008). And near the resistant locus to
C. sojina
race 7,
there was 1 QTL of the resistance locus to soybean
cyst nematode and
Sclerotinia Sclerotiorum
. QTL of
the former were located between Satt411and Satt384
(Guo et al., 2006) and that of the later were located
between Satt411 and Satt212 (Guo et al., 2008). It can
be speculated that the region around Satt411 was a
new cluster of resistant locus and MLG E was
possiblely a main resistance linkage group to fungi.
3 Materials and Methods
3.1 Genetic materials and phenotypic assay
A mapping population of soybean was gained from a
cross between the resistant ‘Gang 95144-1’ and the
susceptible ‘Gongjiao 9723-6’ to
C. sojina
race 7. The
F
1
seeds were grown and selfed, and the leaf of F
2
plants were used for disease evaluation and DNA
extraction. The parents (‘Gang 95144-1’ and
‘Gongjiao 9723-6’) and the F
2
population including
184 individuals were scored for the inoculation with
race 7 of
C. sojina
. The inoculation of the pathogen
and the evaluation of symptoms were fulfilled as
described by Dong et al. (2007).
3.2 DNA bulks and PCR amplifications
Two DNA bulks (resistant and susceptible) were
produced by respectively equally pooling the DNA of
15 resistant and 15 susceptible F
2
plants. The DNA
extraction was carried out as described by Rogers
(1998).