Basic HTML Version


Legume Genomics and Genetics (online), 2010, Vol. 1, No.4, 18-23
http://lgg.sophiapublisher.com
lihood ration 44.31, 34.91 and 10.31 respectively. It
was also calculated that, tendril type and flower colour
was high significantly linked (P<0.00) with number of
leaflet/leaf and pod colour at likelihood ratio 33.21
and 10.32 respectively (Table 2).
Table 2 Association for five combinations of contrasting traits in F
2
population of
Pisum sativum
No.
Morphological traits
Likely hood ratio
Sig.
1
Anthocyanin pigmentation
Flower colour
44.31
0.00**
2
Anthocyanin pigmentation
Seed colour
34.91
0.00**
3
Tendril type
No-leaflet/leaf
33.21
0.00**
4
Flower colour
Pod colour
10.32
0.00**
5
Anthocyanin pigmentation
Pod colour
10.31
0.00**
Note: *: Significant (Sig.) at P<= 0 .05 level; **: High significant (Sig.) at P<=0.01 level
1.3 Analysis F3 generation
In coefficient of variation out of five quantitative traits
total pod weight (49.77%) and number of seeds/pod
(20%) showed maximum level of coefficient of varia-
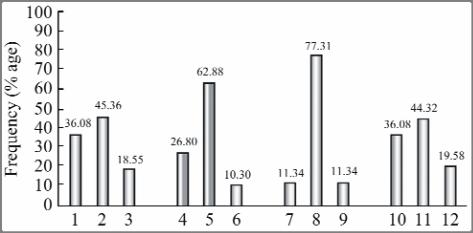
tion (Table 3). Frequency distributions for the traits
were calculated to classify F3 generation into different
categories (Figure 1). It indicated that 18.55% of the
populations were having ≥31.94~47.9 g total pods
weight and 10.30% of the segregants were ranged in
≥7.33~9.17g twenty seeds weight. Similarly, 11.34%
of the total population having ≥8.83~11.05 cm pod
length and 19.58% were ranged ≥5.5~6.8 number of
seeds pod weight (Figure 1).
Table 3 Correlation coefficient of F
3
generation of
Pisum sativum
(L.) based on quantitative traits
Traits
total pod weight
seed weight pod length
total pod weight 1
seed weight
0.27**
1
pod length
0.24**
0.15*
1
Number of
seeds/pod
0.23**
0.05
0.35**
20
Note: *: Significant at P<= 0 .05 level; **: High significant at
P<=0.01 level
Figure 1 Percentage frequency distribution of five quantitative
traits in F
3
generation of
Pisum sativum
(L.)
Note: % age: percentage frequency distribution
In correlation coefficient total pod weight highly sig-
nificantly positively correlated with twenty seed weight
(r=0.27), pod length (r=0.24) and number of seeds/pod
(r=0.23). Likewise, pod length was also highly signify-
cantly positively correlated with number of seeds/pod
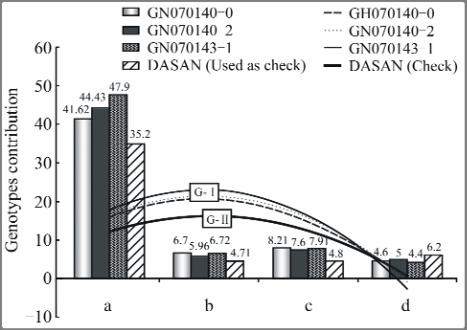
(Table 3). Based on quantitative evaluation in compa-
rison with checks variety DASAN, three lines GN
070140
-
2, GN070143
-
1 and GN070140 were selected
as high yielding powdery mildew resistant lines (Fig-
ure 2). In figure 2, vertical block indicates contri-
bution of the each line and check variety with corres-
pondence to four quantitative traits. Intercept dis-
played average contribution of each line and check
variety to quantitative traits. Intercept clearly grouped
the selected three lines into G-I and cultivars (DA
SAN) into G-II (Figure 2).
Figure 2 Comparison of three high yielding lines with check
variety (DASAN) in F
3
population of
Pisum sativum
(L.).
Vertical block indicates contribution of the lines and check
variety with correspondence to four quantitative traits. Set
intercept displayed average contribution of each line and check
variety to four quantitative traits. G-I group grouped novel lines
and G-II encircle only check variety DASAN