Basic HTML Version


Bioscience Methods
BM 2011, Vol.2, No.1
http://bm.sophiapublisher.com
- 2 -
(SEC-HPLC) was chosen. This method can on-line
detect the concentration of NGF in a much higher
speed and accuracy, and the most important property
is that the detection separation and purification are at
the same time. It will largely reduce the cost of qualify
control in the practical production process.
1 Results
1.1 Selection of chromatographic conditions
The PBS buffer was chosen as mobile phase for that it
is also used as the dissolvent of stock solution. When
the PBS at the condition of pH=7.0 and 0.05 mol/L
ion concentration, it shows the largest NGF peak area
respond and highest column efficiency in the
chromatogram (Figure 1 and Figure 2).As a result, the
chromatographic conditions are finally selected as
follows: Chromatograph: Shimadzu LC
-
10AT VP Plus
HPLC Chromatography; Column: Shodex PROTEIN
KW
-
802.5 No.E703044 Guard
Column: Shodex PROTEIN KW-G No.E712606
Column Temperature: Room Temperature;
Mobile Phase: 0.05 mol/L PBS pH=7 (2.05 g Na
2
HPO
4
+
1.29 g NaH
2
PO
4
•2H
2
O+4.4 g NaCl)/500 mL
Detecting wavelength: 280 nm
Flow rate: 0.8 mL/min
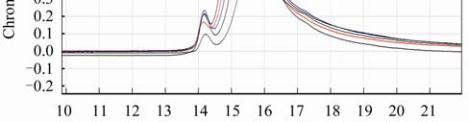
Figure 1 Chromatogram of NGF under different pH condition
Note: The black curve reveals the NGF peak in the pH of 6.96,
red curve of pH=6.74; Blue curve of pH=6.53, Brown curve of
pH=6.32 and green curve of pH=6.11; All are under the
condition of 0.05 mol/L PBS in the speed of 0.8 mL/min
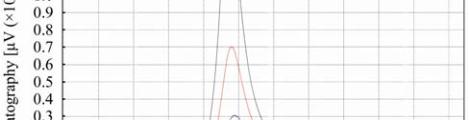
Figure 2 Chromatogram of NGF under different ion concen-
tration condition
Note: The brown curve reveals the NGF peak in the ion
concentration of 0.025 mol/L, blue curve of 0.05 mol/L, black
curve of 0.10 mol/L and red curve of 0.20 mol/L. All are under
the condition of pH=7.0 PBS in the speed of 0.8 mL/min
1.2 Manufacture of the standard curve
1.2.1 Standard curve for stock solution
The standard curve was manufactured using NGF
standard by external standard method. After gradient
dilution of NGF standard, various samples of various
concentrations are detected by SEC-HPLC. We got
chromatograms and the data of retention time, peak
height, peak area and other parameters in every 40 μL
injection. Compiling the data of two parallel
experiments in average, the standard curve was got in
the linear range of 719 μg/mL to 44.9 μg/mL (has
manufactured the standard curve in three different
times, and reveals high repeatability that RSD <1.42%)
(Figure 3; Figure 4 and Table 1).
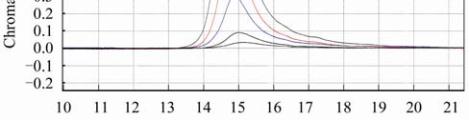
Figure 3 The chromatograms of manufacturing the standard
curve for stock solution
Note: Different color peaks reveal the NGF in different gradient
dilution concentration